A moving waterline is a measurement to interpret
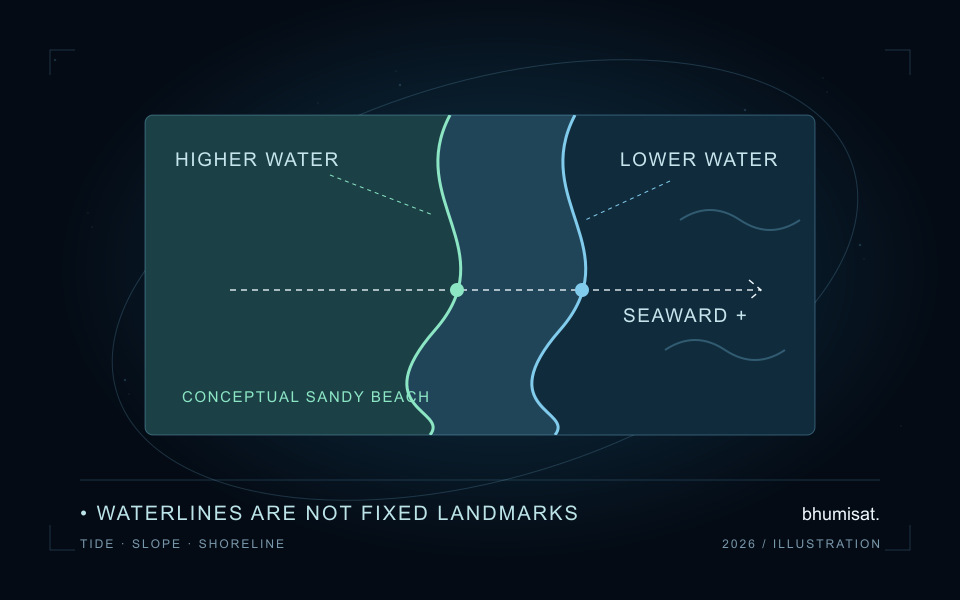
Two satellite images can show different land-water boundaries even when the underlying beach profile has not changed. Water occupies a different part of a sloping beach as its level rises or falls. A line extracted precisely from each image can therefore describe real waterline motion without demonstrating erosion. Before reporting satellite shoreline change, an analyst needs to say which boundary was measured, when it was observed and how differences in water level affect the comparison.
This guide develops a reproducible check for a sandy beach using an invented planar profile. It explains the geometry rather than extracting any real coastline. The method is relevant to coastal application research within BhumiSat's Earth observation concept, but it is not a BhumiSat data product or performance assessment. BhumiSat remains a TechnoGIS research and concept-design initiative studying a multispectral 3U CubeSat and a mission vision for 2030; final mission specifications and operations are unconfirmed.
Name the shoreline proxy before comparing dates
An instantaneous waterline, a wet-dry boundary, a vegetation edge and a contour at a specified elevation are different observables. They should not share a single shoreline label without qualification. A threshold applied to an optical image may follow a sand-water transition on one date and a foam or wet-sand boundary on another. Preserve the extraction method and a reviewed image excerpt so someone can inspect what the reported line actually represents.
CoastSat's developer documentation describes an algorithm optimised for sandy beach coastlines and the use of shore-normal transects to create position time series. This is a useful scope reminder rather than a guarantee for every coast. A rocky cliff, mangrove fringe, muddy estuary or engineered seawall needs its own boundary definition and validation. The simple beach-slope reasoning in this article should not be transferred automatically to those settings merely because they also contain water and land. [1]
Keep time, datum and water-level provenance together
Use the image's sensing time, including its time zone, when associating a water level with a shoreline observation. A date alone cannot identify the relevant tidal stage. Retain the water-level source, station or model location, units, vertical reference and any interpolation method. A nearby gauge can be informative, but its applicability at the beach must be assessed; proximity alone does not prove that two locations experience identical levels or timing.
NOAA defines Mean High Water from high-water observations over a tidal datum epoch, while Mean Sea Level is based on hourly heights. These are reference quantities rather than interchangeable names for one elevation. Converting a waterline to a stated reference level requires compatible vertical references for the water level, profile and target. A correction can be numerically tidy and still be physically inconsistent if one input is referenced to a station datum and another to a different vertical surface. [2]
Derive the sign from an explicit transect
Define a cross-shore coordinate that increases seaward and let the local beach slope magnitude be positive, measured as vertical change divided by horizontal distance. For a planar profile, beach elevation decreases as that coordinate increases. Raising the water surface therefore moves its intersection landward, toward a smaller coordinate. This sign convention should be written beside the formula and saved with the transect orientation; the same algebra copied into a landward-positive system would require a different sign.
With that convention, translating an observed waterline to a target reference level adds the observed water-level excess divided by slope to its seaward coordinate. In symbols, x_ref equals x_obs plus (eta_obs minus eta_ref) divided by m. The CoastSat methods paper describes a linear translation using water level, reference elevation and characteristic beach-face slope. Our expression states its own coordinate convention explicitly, and assumes a straight, unchanged beach profile over the portion traversed by the waterline. [3]
Work through a beach that has not retreated
Suppose the reference-elevation intersection is at a seaward coordinate of one hundred metres and the beach slope magnitude is 0.02, equivalent to one unit vertically for fifty horizontally. At a water level of 0.20 metres above that reference, the synthetic waterline lies at ninety metres. At 0.80 metres it lies at sixty metres. The raw difference is thirty metres landward, although the assumed beach has remained perfectly unchanged.
Applying the stated translation returns both positions to one hundred metres. This is an arithmetic consistency check, not proof that tidal correction would remove every difference in a real dataset. The invented observations were constructed from the same planar model used to translate them. A field assessment needs independently surveyed profiles or shoreline references, appropriate timing and an account of extraction and positioning errors. It should test where the model fails rather than treating the toy example's zero residual as achieved accuracy.
Treat astronomical tide as one part of the context
A predicted astronomical tide does not describe every process affecting a visible beach boundary. USGS explains coastal storm water levels using tides, surge and wave contributions, including setup and swash within wave runup. That framework is a reason to inspect sea-state context before applying a tide-only adjustment. The boundary in a satellite image is not automatically the same observable as a modelled extreme total-water-level statistic, so those quantities should not be substituted without a physical justification. [4]
Record whether an acquisition contains a broad surf zone, foam patches, shadows, cloud contamination or an ambiguous wet-sand transition. Review both raw and adjusted lines against the same image. An unusually large translation should trigger inspection of slope, datum, timing and proxy choice rather than automatic acceptance. If those inputs cannot support a defensible comparison, retain the original observation with an exclusion reason. A missing trend estimate can be more informative than a precise-looking result built from incompatible boundaries.
Measure sensitivity before choosing a change threshold
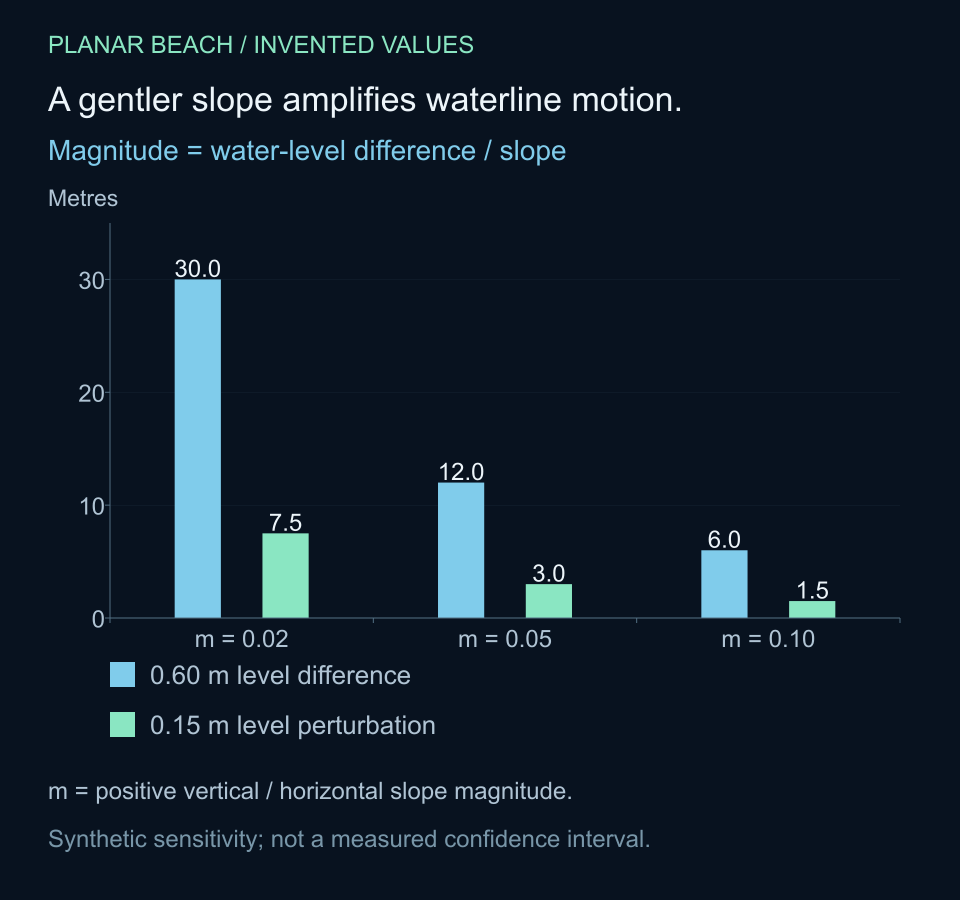
The horizontal effect of a water-level difference depends strongly on slope. In the planar example, a rise of 0.60 metres produces motion magnitudes of thirty, twelve and six metres at slopes of 0.02, 0.05 and 0.10 respectively. A separate water-level perturbation of 0.15 metres corresponds to horizontal sensitivities of 7.5, three and 1.5 metres. These are calculated scenario values, not a confidence interval or a specification for an imaging instrument.
The accompanying Python example checks the coordinate convention and prints those sensitivities without external packages or downloads. Keep the distinction between a chosen perturbation and a measured uncertainty. To build an uncertainty assessment, justify the water-level error model and consider slope uncertainty, image registration, line extraction and the match between the proxy and reference survey. Shared offsets may also correlate errors across dates; adding every contribution as if it were independent can misrepresent the uncertainty of a change estimate.
A single slope may be inadequate where a beach face changes shape, contains a berm or is surveyed over the wrong elevation range. Compare plausible slopes that represent the traversed profile and inspect the resulting adjusted series. A result that changes interpretation across a reasonable slope range should carry that dependence into its report. Do not tune the slope simply to remove a surprising trend: that would use the desired result to choose the correction.
# Invented planar beach. x increases seaward; m is positive slope magnitude.
def to_reference(x_observed, eta_observed, eta_reference, m):
    if m <= 0:
        raise ValueError("Slope magnitude must be positive")
    return x_observed + (eta_observed - eta_reference) / m

slope = 0.02
positions = [90.0, 60.0]
levels = [0.20, 0.80]
normalised = [to_reference(x, eta, 0.0, slope)
              for x, eta in zip(positions, levels)]
print(f"Raw change: {positions[1] - positions[0]:.1f} m")
print(f"Reference-level change: {normalised[1] - normalised[0]:.1f} m")
for m in [0.02, 0.05, 0.10]:
    motion = 0.60 / m
    sensitivity = 0.15 / m
    print(f"m={m:.2f}: motion={motion:.1f} m, sensitivity={sensitivity:.1f} m")
# Raw change: -30.0 m
# Reference-level change: 0.0 m
# m=0.02: motion=30.0 m, sensitivity=7.5 m
# m=0.05: motion=12.0 m, sensitivity=3.0 m
# m=0.10: motion=6.0 m, sensitivity=1.5 m
Save an auditable shoreline comparison
For each observation, save an acquisition identifier and sensing timestamp, extraction method, line geometry, coordinate reference system, transect identifier and orientation. Keep the unadjusted position alongside the water level, its source and datum, the target elevation, slope estimate, signed correction and adjusted position. Record quality decisions and parameter versions rather than overwriting an old result with the latest correction. A reviewer should be able to reconstruct a point in the time series from those inputs.
Validation should compare like with like: the same defined shoreline proxy or reference elevation, over an appropriate spatial and temporal support. Check registration against stable features and inspect transects with multiple intersections. Report the number of retained dates and transects, exclusion causes and sensitivity to the adjustment assumptions. An extraction precision smaller than a pixel is an algorithmic output property; it does not, on its own, demonstrate comparable absolute shoreline accuracy or reliable detection of change of that magnitude.
Turn coastal comparisons into research requirements
For BhumiSat's coastal research, these checks help define the evidence a useful observation workflow would need. A beach study may require accurate sensing times, traceable geolocation, a consistent boundary proxy, local water-level information and representative profile measurements. Those requirements follow from the comparison being attempted. They should be investigated with suitable existing imagery and field evidence before claiming that a proposed spacecraft configuration can deliver a coastal monitoring service.
A defensible statement of shoreline change explains the raw displacement, what was adjusted and which assumptions remain unresolved. Tide normalisation can make observations more comparable, but it cannot turn an unsuitable proxy or unsupported slope into verified beach retreat. Preserve the waterline as an observation and treat the erosion interpretation as a separate conclusion that needs evidence. That separation makes a satellite image useful for coastal science while keeping the limits of an early mission concept visible.
Sources & further reading
Connect these comparisons to traceable field-to-pixel validation, explore multispectral sensing concepts, or read the research questions behind BhumiSat's 2030 vision.