A multispectral satellite sensor records selected parts of the electromagnetic spectrum separately. That separation allows analysts to investigate contrasts that are difficult to recognise in an ordinary colour photograph. For agriculture, a useful starting point is understanding the relationship between visible red, green and blue measurements, the Red Edge region and near-infrared reflectance. Together, these observations can support several complementary ways of describing vegetation.
This article forms the 2022 thematic chapter of our retrospective Earth observation series. It explains the spectral configuration being considered within the bhumisat concept: RGB, Red Edge and NIR. The designation describes an intended set of measurements under study. It does not establish a final optical design, flight-qualified instrument or verified on-orbit performance, and it should not be read as a historical deployment claim.
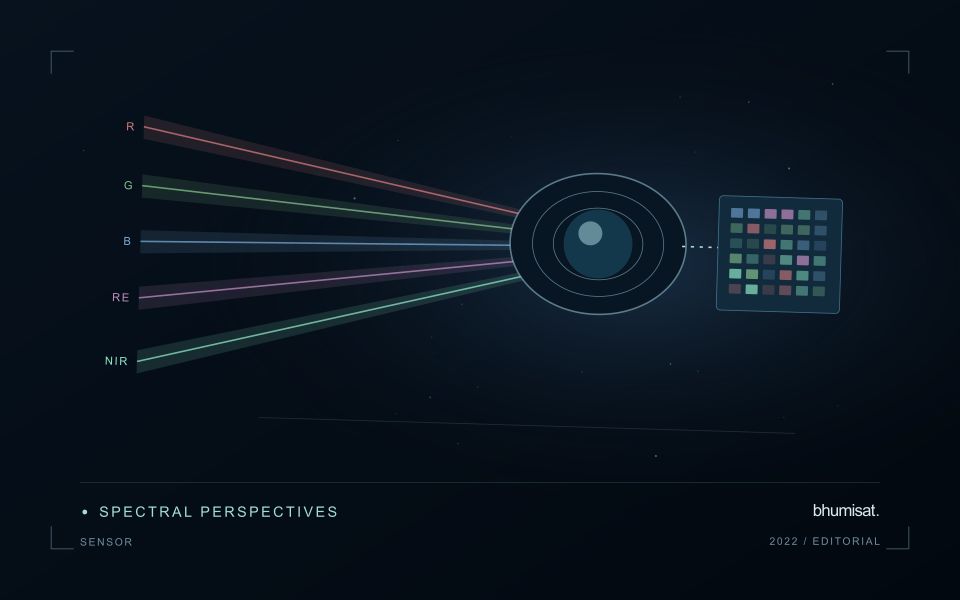
RGB contains three spectral channels
RGB stands for red, green and blue. In a multispectral context, these are three separate measurements rather than one band called RGB. Adding one Red Edge channel and one near-infrared channel results in five intended spectral channels. Stating the individual channels helps collaborators understand the concept and avoids ambiguity when comparing it with cameras that use a different band arrangement.
A natural-colour composite uses visible bands to produce an image that resembles familiar human vision. Such imagery can help teams recognise field patterns, roads, bare soil and visible changes in a canopy. It is valuable for interpretation and communication, although the colours shown on a display depend on how the image is scaled and processed.
Why near-infrared matters for vegetation
Near-infrared, or NIR, lies beyond the visible range of human vision. Vegetation can exhibit a strong contrast between its response in red and NIR wavelengths. NASA's overview of Landsat spectral bands explains how measurements outside the visible spectrum add information about land surfaces. An NIR channel expands the analytical possibilities beyond those of a three-channel visible camera. [1]
The presence of an NIR band does not mean the camera measures plant health directly. The recorded signal is influenced by canopy structure, background materials, illumination and the way the instrument samples the scene. A reliable interpretation connects the spectral measurement with a defined application and suitable validation. The same index threshold should not be assumed to describe equivalent conditions across every crop.
What the Red Edge adds
The Red Edge refers to the spectral transition between strong vegetation absorption in the red region and greater reflectance toward near-infrared wavelengths. A channel positioned within this transition can add information useful for vegetation research. ESA describes the role of Sentinel-2 Red Edge observations in examining plant condition and related biophysical properties. [2]
Band placement matters. Two instruments can both advertise a Red Edge channel while observing different wavelength ranges or bandwidths. Their measurements may therefore respond differently to the same canopy. A specification should eventually define more than the channel name: it should describe the spectral response and calibration characteristics needed to compare the observations with reference measurements.
From spectral channels to vegetation indices
Vegetation indices combine measurements to emphasise particular contrasts. NDVI uses red and NIR reflectance, while a common form of NDRE uses Red Edge and NIR reflectance. These indices can provide complementary views of vegetation, depending on the crop and conditions. They remain analytical features whose practical meaning must be established for the intended application, rather than universal health scores.
For example, an agricultural research team might compare several features against field observations of canopy development. The team should evaluate whether the Red Edge measurement adds useful information beyond the visible and NIR channels already available. A more complex index or model is worthwhile when it improves validated performance or operational usefulness, rather than simply increasing the number of outputs on a dashboard.
Spectral capability and spatial detail are separate choices
A camera can record useful wavelengths while still providing insufficient spatial detail for a particular field pattern. Conversely, a very detailed visible image may lack the spectral channels required for a selected vegetation index. Sensor selection needs to consider both questions. The right balance depends on field size, management needs, observation frequency and the constraints of the complete mission.
Sentinel-2 offers a useful example of this distinction because its bands have different native spatial resolutions. Analysts working with its data should understand which measurements were acquired at which resolution before combining them. Resampling can place layers on a common grid, but it does not create newly measured surface detail in a coarser source band. [3]
Calibration gives measurements a common meaning
Raw digital values depend on the detector and acquisition settings. A quantitative monitoring workflow needs a documented route from those values to an appropriate physical or comparable measurement. Laboratory characterisation, radiometric calibration and checks using reference observations help establish that route. For a satellite instrument, calibration planning should begin while the payload requirements are still being defined.
Band alignment also matters. If red and NIR observations are slightly displaced, a field edge may combine information from different surface materials. The resulting index can show an artefact that resembles real variation. Optical layout, processing and geographic accuracy all contribute to controlling this problem. A detailed payload study therefore considers geometric performance alongside spectral sensitivity.
Keep illumination and the atmosphere in the workflow
The signal observed from orbit has travelled through the atmosphere and depends on illumination and viewing conditions. Clouds and shadows may make a measurement unsuitable for a crop comparison. Atmospheric correction and quality screening help produce more consistent inputs, while remaining imperfections should be considered during validation. The presence of five spectral channels does not remove these conditions.
This is why a satellite monitoring report should show its observation date and quality status. A field with a recent clear image and a field observed only through uncertain conditions should not receive indistinguishable confidence labels. Agricultural users need to know whether the result supports an immediate inspection, a cautious comparison or a request for another observation.
Build a field campaign around the intended question
Validation should measure the quantities relevant to the product being developed. Research into canopy development may use a different field protocol from a study of nutrient-related variation or crop classification. The protocol should define sampling locations, timing, reference methods and how satellite pixels relate to the observed plots. A well-documented dataset is more valuable than a large collection of poorly aligned labels.
A hypothetical commodity study could begin with a limited set of fields representing several growth stages. Researchers would collect reference observations near the image acquisition dates, evaluate candidate spectral features and reserve independent fields or seasons for testing. The results could then inform the required band configuration. This sequence connects an instrument decision to evidence about its intended application.
What these bands do not provide on their own
RGB, Red Edge and NIR measurements do not include a thermal band. A five-channel configuration with those labels should therefore not be described as directly measuring land-surface temperature. It also does not include a shortwave-infrared channel merely because NIR is present. Some research questions may require complementary instruments, additional spectral coverage or field measurements beyond the proposed configuration.
Likewise, the band list alone cannot establish crop-yield accuracy, revisit frequency or ground resolution. Those outcomes depend on the optical system, orbit, pointing, data handling, processing and validation. Clear communication of these distinctions helps researchers and partners evaluate a concept on its actual evidence while identifying the studies still required.
Connecting the sensor concept with an Earth observation mission
For bhumisat, a multispectral configuration is one part of a wider development programme. The productive next step is to turn the channel names into testable requirements and compare candidate designs against agricultural use cases. Existing satellite imagery, controlled measurements and field observations can help investigate those requirements before final mission specifications are established.
The practical value of RGB, Red Edge and NIR emerges when the measurements support a useful decision. A thoughtful sensor design preserves the information needed for that task, while the surrounding workflow makes its quality and meaning understandable. This connection between instrument research and field application is the basis for an Earth observation concept that can mature responsibly toward a future mission.
Sources & further reading
Explore the bhumisat spacecraft concept and our vision towards 2030, or return to the journal.