A workflow that succeeds on a small study area may encounter different constraints when the number of observations, locations, or users increases. Scaling requires attention to processing capacity, data organisation, reference coverage, and the effort needed to review results. This perspective looks beyond whether a calculation can run on a larger dataset. It asks whether the complete service can preserve its meaning, quality, and delivery commitments as its scope expands. The objective is a design that identifies bottlenecks early and increases throughput without silently weakening the evidence available to users.
This working guide considers rgb satellite imagery for field interpretation in citrus orchard blocks. The immediate decision is to target orchard inspection visits. Useful reference evidence includes tree-row structure, irrigation notes and canopy observations. The case is an illustrative planning context, with assumptions to check against the actual sensor, landscape and project requirements.
Use visible context carefully
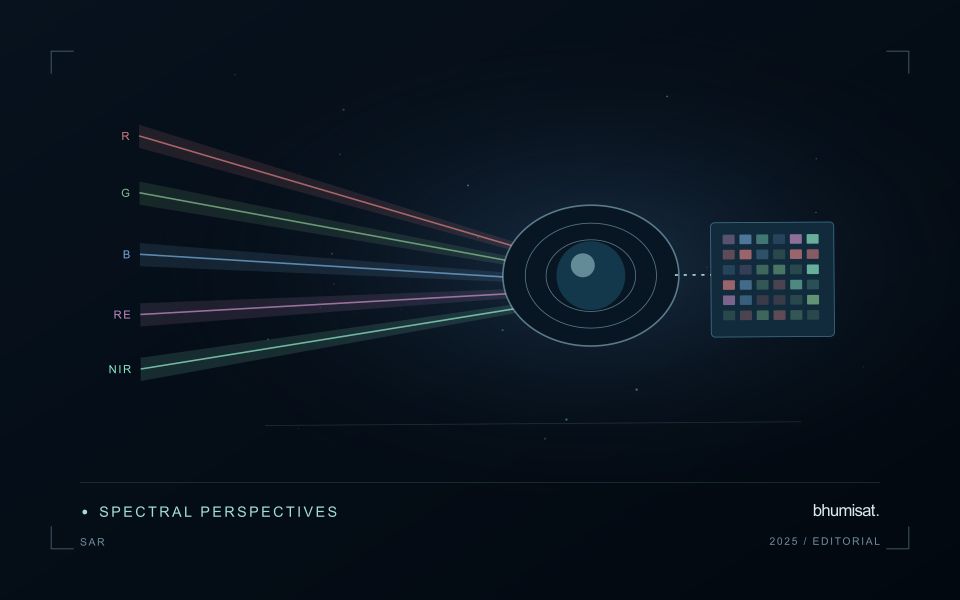
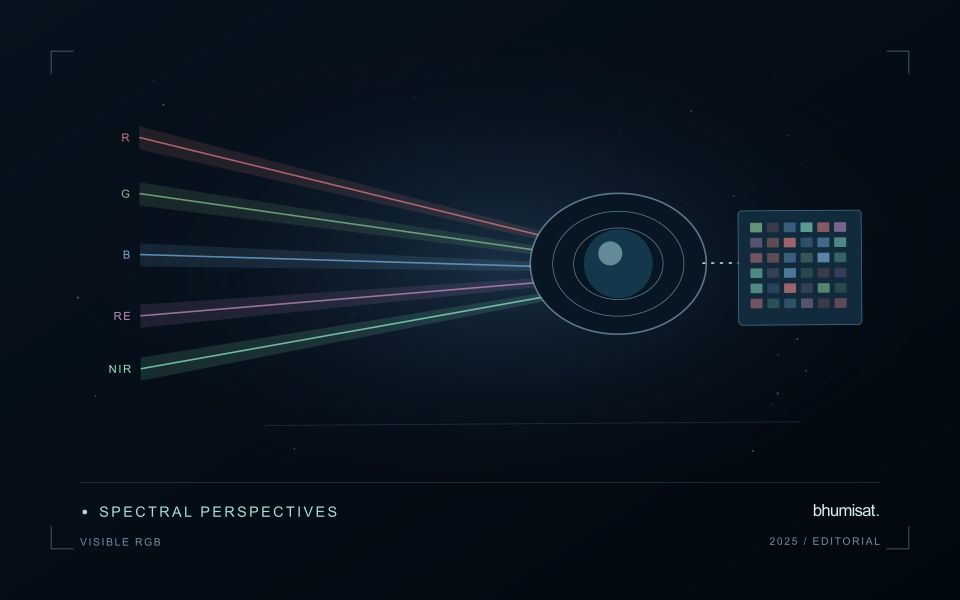
A familiar colour image combines red, green and blue measurements into a display that resembles human visual experience. That familiarity helps people recognise fields, roads, exposed soil, water and settlement patterns. It can also create a false sense that interpretation is effortless. Satellite imagery is influenced by acquisition conditions, processing and display choices. The image may not show the same colours an observer would have seen from the ground. Its value lies in spatial context, supported by a clear account of how the display was produced.
Contrast stretching makes subtle patterns easier to see, but it can make two dates look different even when the underlying reflectance is similar. An automatic stretch selected separately for each image is useful for exploration and less suitable as evidence of a measured change. Keep acquisition dates visible and distinguish a display adjustment from an analytical transformation. When comparing scenes, use a consistent viewing approach and inspect the original values or a suitable quantitative product before drawing a conclusion from colour alone.
Prepare a repeatable visual review
Visible imagery supports a practical first review of a monitoring result. Check whether a field boundary follows the current cultivated area and whether paths, buildings or neighbouring vegetation are included accidentally. Look for management changes that may explain a spectral anomaly, such as harvest, replanting or newly exposed ground. A visual check can identify a plausible explanation and guide field inspection. It should not be presented as proof of a specific disease, nutrient deficiency or production outcome without evidence suited to that claim.
A repeatable review protocol records what the analyst examined and how confidently it could be interpreted. The record can include cloud and shadow presence, obvious mapping errors, the age of the image and any feature requiring confirmation. Use agreed descriptions so that different reviewers can compare their findings. Where a detail is smaller than the available spatial information, acknowledge that limitation and seek a complementary observation. RGB imagery is a useful interface between technical analysis and field knowledge when its visual clarity is accompanied by disciplined interpretation.
The setting: Citrus orchard blocks
A citrus orchard is a structured mixture of tree crowns and the surfaces between them. Row spacing, tree age, canopy size and ground management can all influence the observed response. A young block with substantial exposed soil should not be compared directly with a mature block without considering this structure. Decide whether the output is intended to describe the whole management block, the tree canopy or a particular agronomic parameter.
The scale of the imagery determines how clearly those components can be separated. Where individual crowns cannot be resolved reliably, block-level analysis may be more defensible than presenting apparent tree-by-tree detail. Retain irrigation and maintenance records alongside the image sequence, and examine whether recent ground-cover work could explain a change. Cloud screening, geometric alignment and stable boundaries remain important even in regions where usable optical observations are relatively frequent.
A field visit should distinguish canopy observations from conditions in the inter-row area. Record tree age, recent pruning, irrigation context and the location of any measurements used to investigate a flagged zone. A remote-sensing alert cannot by itself establish a named disease or a nutritional diagnosis. Evaluate whether the information helps orchard staff select productive inspection locations, and use suitable independent evidence before extending the service to claims about fruit yield or quality.
Maintain the geographic units of analysis
Many observation services summarise measurements within a field, management block, catchment, forest unit, or other mapped boundary. The meaning of that summary depends on whether the boundary accurately represents the unit being discussed. Start with a clear source for the geometry and record its date, coordinate reference, and intended use. A boundary drawn for visual orientation may require additional checking before it becomes a measurement unit.
Inspect overlaps, gaps, narrow fragments, and features that may have changed since mapping. A geometrically valid polygon can still describe an outdated operational unit. Ask the responsible team how divisions, mergers, new infrastructure, and management changes are recorded. Where pixels or reference measurements cross a boundary, define how they are assigned or excluded so that results remain comparable between analysts and processing runs.
Version the boundaries alongside the observations. If a unit changes, preserve a relationship between the previous and revised geometry rather than replacing the history without explanation. Comparisons through time should identify whether they use a constant spatial unit or the operational units valid at each date. This makes it easier to distinguish a change in the measured surface from a change introduced by the geography used to summarise it.
Locate the uncertainty that matters to the decision
An uncertainty budget is a practical description of where a result could become unreliable. Begin with the observation chain: acquisition, calibration, geographic matching, reference measurements, feature calculation, modelling, and delivery. Identify the assumptions at each stage and ask which could materially change the interpretation. The purpose is not to assign a precise number to every limitation. It is to locate the sources that deserve attention for the intended decision.
Separate limitations that can be measured from those that currently require a qualitative description. Repeated measurements may help characterise variability, while comparisons with independent references can reveal systematic differences. Some uncertainties interact, so combining individual error estimates without examining their relationships can produce a misleading impression of precision. Keep the method of assessment visible and avoid treating an unexamined assumption as though it were a negligible contribution.
Use the budget to prioritise further work. The largest visible source of variation is not always the one whose reduction would most improve the decision. Consider which additional observation, test, or contextual record would change confidence in an actionable way. Revisit the budget when the application, observation source, or deployment conditions change. This turns uncertainty analysis into a guide for improving the workflow rather than a qualification added only after the result has been delivered.
Bring the evidence back to the decision
Expansion should be guided by measured workload, visible quality conditions, and an understanding of which tasks require expert attention. Test the workflow under representative data volumes before treating a successful demonstration as evidence of operational capacity. Preserve a route for investigating individual observations even when most processing is automated. A scalable service keeps its results traceable and useful as it grows, with clear choices about where to automate, where to review, and where to invest in additional evidence.
Sources & further reading
Explore the bhumisat spacecraft concept and our vision towards 2030, or return to the journal.