An analytical result becomes operational information only when the receiving team can understand it and use it within existing responsibilities. Handoffs often fail because assumptions that were obvious to the analyst are absent from the delivered product. This perspective considers the information needed at that boundary: acquisition time, processing status, geographic scope, quality qualifications, and the action expected from the recipient. It also asks how corrections and feedback should return to the producing team. A dependable handoff creates a shared understanding of the result, rather than merely transferring a file.
This working guide considers red edge sensing for vegetation studies in citrus orchard blocks. The immediate decision is to target orchard inspection visits. Useful reference evidence includes tree-row structure, irrigation notes and canopy observations. The case is an illustrative planning context, with assumptions to check against the actual sensor, landscape and project requirements.
Observe a transition, not a universal plant score
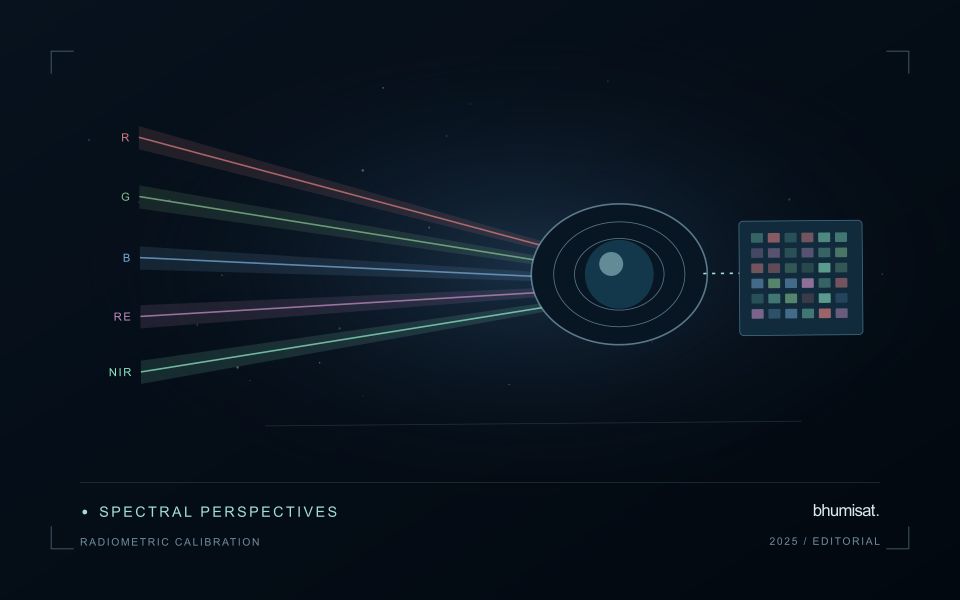
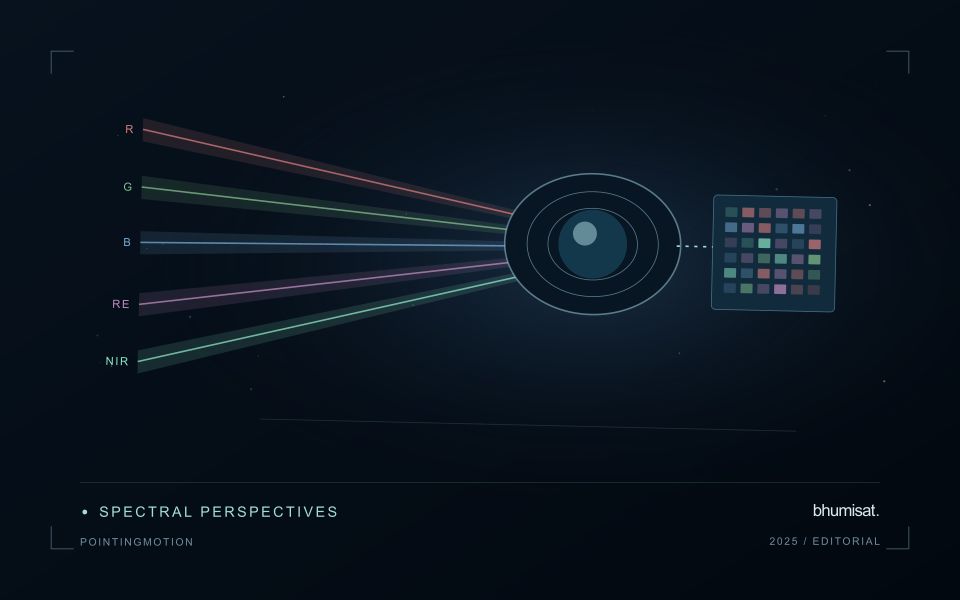
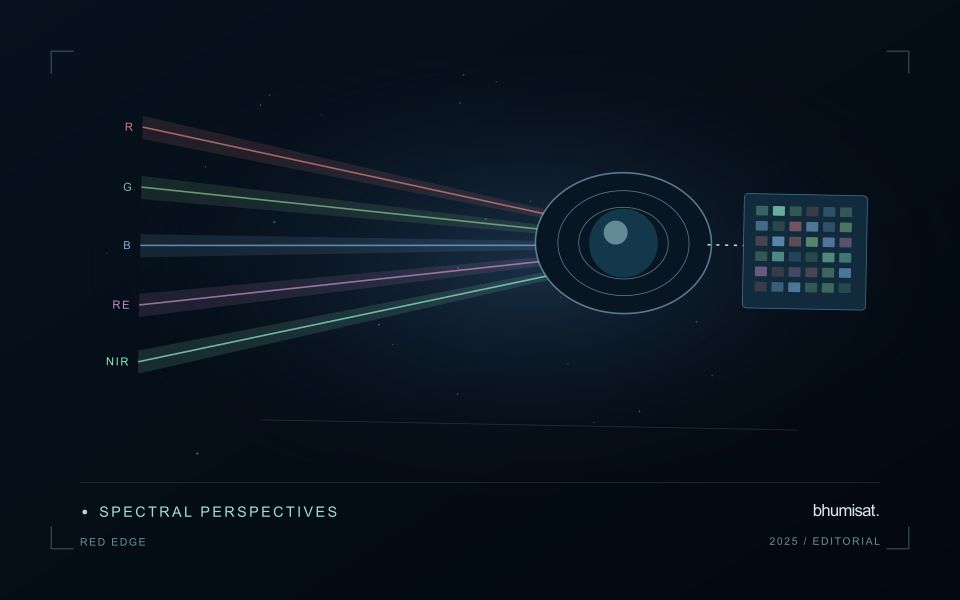
The Red Edge is a transition region in the spectral response of vegetation between visible red absorption and near-infrared reflectance. Measuring this region can add useful information to a vegetation study because different channels sample different parts of the transition. The phrase Red Edge is therefore a broad description rather than a complete instrument specification. A study needs the channel response, its bandwidth and its relationship to the other measurements used in the analysis. Those details influence what comparisons can be made reliably.
Leaf properties and the arrangement of leaves within a canopy both affect the signal reaching a satellite. The observed field also contains shadows, branches, soil and sometimes water or understory vegetation. Consequently, a relationship established with a leaf instrument cannot simply be assumed to hold at satellite-pixel scale. Scaling the interpretation requires observations that connect these levels. This distinction becomes especially important when the intended application concerns a specific biochemical parameter, because the image records a combined landscape response rather than an isolated leaf measurement.
Design the comparison around the instrument
Start an application study by identifying the information that an added Red Edge channel is expected to contribute. Compare that expectation with available data from established instruments and with a baseline method using fewer bands. Check whether any apparent improvement persists in independent fields and seasons. Use the same evaluation protocol for both methods. An instrument design decision should consider the improvement alongside calibration, alignment, signal quality and processing demands. More channels introduce more measurement opportunities and more relationships that must be understood.
For an ongoing service, retain enough metadata to trace every result to its source bands. A change in sensor, processing version or band selection can create a discontinuity in an otherwise plausible time series. Validate the transition rather than hiding it within a long historical chart. Clear documentation allows a user to distinguish a change in vegetation from a change in the observation system. Red Edge sensing becomes valuable when its additional spectral information can be linked to a defined application through repeatable measurements and independent evidence.
The setting: Citrus orchard blocks
A citrus orchard is a structured mixture of tree crowns and the surfaces between them. Row spacing, tree age, canopy size and ground management can all influence the observed response. A young block with substantial exposed soil should not be compared directly with a mature block without considering this structure. Decide whether the output is intended to describe the whole management block, the tree canopy or a particular agronomic parameter.
The scale of the imagery determines how clearly those components can be separated. Where individual crowns cannot be resolved reliably, block-level analysis may be more defensible than presenting apparent tree-by-tree detail. Retain irrigation and maintenance records alongside the image sequence, and examine whether recent ground-cover work could explain a change. Cloud screening, geometric alignment and stable boundaries remain important even in regions where usable optical observations are relatively frequent.
A field visit should distinguish canopy observations from conditions in the inter-row area. Record tree age, recent pruning, irrigation context and the location of any measurements used to investigate a flagged zone. A remote-sensing alert cannot by itself establish a named disease or a nutritional diagnosis. Evaluate whether the information helps orchard staff select productive inspection locations, and use suitable independent evidence before extending the service to claims about fruit yield or quality.
Design an evaluation that reflects deployment
A model evaluation should resemble the conditions in which the model will be used. Start by identifying which relationships the development data share: nearby locations, repeated observations of the same unit, common collection teams, or measurements from a single period. These relationships can make records less independent than they appear. An evaluation that ignores them may test the ability to recognise familiar conditions rather than the ability to operate in a new setting.
Choose a split strategy that matches the intended transfer. Holding out locations, seasons, operational units, or acquisition conditions can answer different questions. Document which question each split is designed to address, and keep the held-out evidence separate while selecting features and tuning the method. Repeatedly inspecting the same evaluation set to improve a model gradually makes that set part of development, even if it retains its original label.
Report results at a scale that is meaningful to the user. A strong average can hide poor performance for important subgroups or unusual conditions. Examine error patterns and retain examples of both successful and unsuccessful predictions. Where the evidence covers only a limited range of conditions, describe that range explicitly. The evaluation then becomes a practical guide to suitable use, further testing, and the collection of additional reference observations.
Budget the complete processing workflow
A processing budget should cover the complete path from source observations to a maintained product. Data access and computing are only part of that path. Include preparation, geographic updates, reference collection, expert review, delivery, and support where those activities belong to the service. A calculation that runs cheaply on a small demonstration can still require substantial effort when the surrounding work is repeated across many locations.
Measure representative tasks rather than assuming that every observation costs the same amount to process. Record data volume, processing time, retry frequency, manual interventions, and the conditions that create unusually demanding cases. Separate fixed setup work from work that grows with the number of observations or users. These records support decisions about batching, caching, storage policy, and the point at which a different processing design becomes worthwhile.
Connect the budget to a defined level of service. Faster delivery, more frequent observation, broader coverage, or more detailed review can each change the resources required. Describe these trade-offs before promising a delivery pattern that the workflow has not demonstrated. Review the budget using operational evidence and preserve enough detail to understand changes between processing versions. The aim is a sustainable service whose resource choices remain aligned with the information that users value.
Bring the evidence back to the decision
A successful handoff leaves the recipient with a clear result, sufficient context, and a practical route for raising questions. Test the delivery with the people who will use it, including how they respond when observations are missing or qualified. Capture their feedback as evidence for improving the product. The most useful delivery format is the one that preserves the relevant technical meaning while fitting the decisions, time constraints, and responsibilities of its intended audience.
Sources & further reading
Explore the bhumisat spacecraft concept and our vision towards 2030, or return to the journal.