Comparisons through time are valuable only when the observations are sufficiently comparable for the question being asked. A difference between dates can reflect real change, a normal stage in a seasonal cycle, or a difference in how the surface was observed. This perspective examines the reference period, the timing of acquisitions, and the contextual records needed to interpret a sequence. It encourages the use of appropriate baselines rather than treating every previous observation as an equivalent benchmark. The objective is to identify changes that remain meaningful after normal variation and measurement conditions are considered.
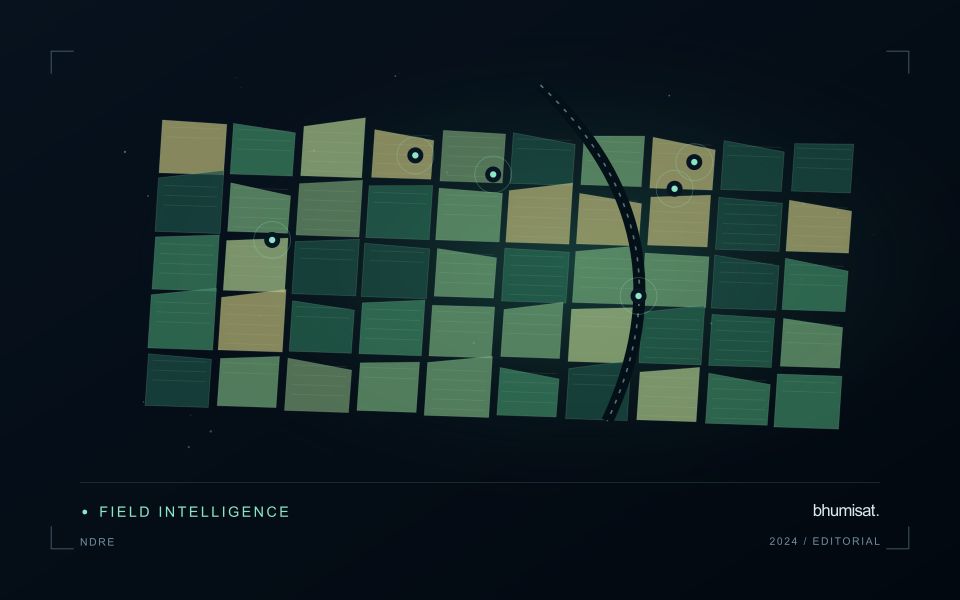
This working guide considers ndre and crop canopy interpretation in potato growing fields. The immediate decision is to focus scouting within potato fields. Useful reference evidence includes emergence records, canopy stage and representative plot observations. The case is an illustrative planning context, with assumptions to check against the actual sensor, landscape and project requirements.
The setting: Potato growing fields
Potato monitoring begins with the distinction between the canopy visible from above and the crop component ultimately harvested below ground. Establishment timing, variety, row structure and management can create different canopy patterns across fields. An image service should specify whether it is supporting crop-stage assessment, identifying areas for inspection or estimating a defined production variable. These objectives require different reference measurements and should not be combined into one unqualified vegetation score.
Maintain a field timeline that includes planting, emergence and the operations that can affect canopy appearance. Early observations may contain a large soil contribution, while later observations may show a more continuous canopy. Cloud and shadow contamination, field edges and neighbouring land cover can alter summaries at either stage. Compare observations using suitable quality rules and retain the acquisition dates so that a recent-looking map does not conceal an old measurement.
A field team should collect consistent crop-stage and canopy observations across both flagged and typical areas. Record management context and sampling support rather than relying on an isolated photograph. A vegetation change cannot establish the presence of a specific disease, and a canopy index is not a direct measurement of tuber yield. Evaluate any production model with appropriate harvest data and independent assessment, while keeping the simpler inspection-priority product transparent about what it actually observes.
Define the Red Edge measurement precisely
NDRE uses the contrast between near-infrared reflectance and a selected Red Edge band, commonly expressed as a normalised difference. Its meaning depends on the actual spectral response of those channels. Two instruments described as having Red Edge capability may observe different wavelength intervals, so their index values are not automatically interchangeable. Record the selected bands, the product level and any resampling applied to them. This is particularly important when a monitoring service combines observations from several satellite or aerial instruments.
The Red Edge region captures a transition between strong absorption in red wavelengths and the higher reflectance often observed in near-infrared wavelengths over vegetation. A measurement in that transition can provide information that differs from a conventional red band. However, canopy structure, growth stage, soil visibility and illumination also influence the observed signal. An apparent improvement over another index should be demonstrated for a defined crop parameter and evaluation dataset, rather than inferred from the presence of an additional spectral channel alone.
Separate spectral sensitivity from agronomic evidence
A sound comparison uses compatible surface reflectance inputs and observations of similar quality. Inspect cloud edges, shadows, band alignment and field boundaries before interpreting small changes. Bands with different native spatial sampling may require a common grid, but resampling does not create new measured ground detail. Where the field contains only a few usable pixels, boundary mixing can dominate the result. Summarising an interior area separately from the full field can help reveal that sensitivity, provided the exclusion rule is documented consistently.
An agricultural model built around NDRE needs independent measurements of the parameter it claims to estimate. If the objective concerns leaf or canopy condition, the field protocol should specify what is measured, where, when and at what scale. Keep calibration observations separate from the final evaluation sample. Examine performance across crop ages and management regimes, including difficult cases. The resulting evidence can support a targeted application, while uncertainty and sampling limits remain visible. A spectral response is an observation; an agronomic conclusion requires an additional, tested relationship.
Prioritise alerts using evidence and consequence
An alert is a request for attention, so its design should consider both the evidence available and the cost of responding. Begin by distinguishing a measured change, a proposed interpretation, and the action expected from the recipient. A large numerical difference is not automatically the most urgent case. The significance of the location, the age of the observation, the confidence in the interpretation, and the consequences of delay can all influence priority.
Create a review queue with enough context to support consistent decisions. Useful information can include the supporting dates, quality qualifications, previous observations, geographic unit, and the reason the case entered the queue. Define when an alert can be closed, escalated, or held for another observation. A documented rule is easier to improve than an informal practice that depends entirely on the memory of the operator reviewing the result.
Collect feedback from inspections and operational responses. Record alerts that led to a useful finding, alerts that required no action, and important conditions that the system failed to flag. Review these outcomes across different settings rather than relying only on a total count of alerts. The objective is a queue that directs limited attention towards meaningful decisions, while generating evidence for adjusting thresholds, improving context, and reducing repeated sources of unnecessary work.
Represent gaps without inventing observations
A monitoring sequence often contains periods without a usable observation. The reason may be cloud, shadow, missing coverage, a failed transfer, or a quality condition that excludes the data. Begin by representing these states explicitly. A missing observation is different from a low measurement, an unchanged surface, or a confirmed absence of the feature being studied. The distinction should survive both the analysis and the presentation of the result.
Define when a temporal gap is acceptable for the intended decision. A workflow may continue using the latest qualified observation, request another source, or suspend an alert until sufficient evidence is available. Whichever response is selected, show the age of the supporting observation. If interpolation is used for a suitable analytical purpose, preserve the distinction between an estimated value and a directly observed measurement, together with the assumptions needed to interpret it.
Review how gaps affect the coverage of the final evaluation. Locations with frequent missing data may differ systematically from those with regular observations. A performance estimate based only on clear, complete records can therefore describe a narrower population than the service is expected to support. Report usable coverage alongside analytical results and use recurring gaps to guide acquisition planning, reference collection, and the selection of complementary observation methods.
Bring the evidence back to the decision
A useful comparison preserves the dates, quality conditions, and contextual assumptions behind its baseline. Review unusual results against the actual observation sequence rather than relying entirely on a summary statistic. Where seasonal timing is important, describe how comparable stages were identified. The resulting analysis should help users distinguish an informative change from an expected cycle or an observation artefact, while making gaps and remaining uncertainty visible enough to guide further investigation.
Sources & further reading
Explore the bhumisat spacecraft concept and our vision towards 2030, or return to the journal.