Remote observations show patterns, while practical decisions depend on explaining what those patterns could mean. Interpretation therefore requires more than locating a high or low value on a map. A useful analysis considers the timing of the observation, the physical processes that influence the measurement, and the information available from complementary sources. This perspective separates an observed signal from a proposed explanation and from an action recommended to a user. Keeping those stages distinct makes it easier to investigate alternative causes, communicate ambiguity, and choose a proportionate next step.
This working guide considers mixed pixels and field boundary effects in turbid coastal waters. The immediate decision is to identify coastal sampling priorities. Useful reference evidence includes water samples, surface conditions and acquisition-time context. The case is an illustrative planning context, with assumptions to check against the actual sensor, landscape and project requirements.
The setting: Turbid coastal waters
Turbid coastal waters contain changing mixtures of suspended material, dissolved substances, biological components and surface reflections. Their image appearance may vary over short distances and between acquisitions. A monitoring design should identify which variable or pattern it aims to investigate rather than treating every colour difference as a direct water-quality measurement. Coastal geometry and the proximity of land also influence which parts of an image provide a defensible observation of water.
Review atmospheric conditions, cloud, shadow, sun glint and land adjacency before comparing spectral measurements. Shallow-bottom contributions can matter in some places, while deeper areas may present a different interpretation problem. A relationship developed for one water type should not be transferred automatically to another. Retain the valid observation mask and the dates supporting each map so that users can distinguish measured patterns from periods without suitable optical evidence.
Field validation should sample the range of conditions in which a model or interpretation rule will operate. Record collection time, location and the measurement method for the target variable, together with relevant surface conditions. Samples and imagery separated by a changing coastal event may not be comparable. A useful product can guide sampling or describe a consistent spectral pattern, with stronger numerical water-quality claims introduced only when their calibration and independent evaluation support the intended application.
A pixel can represent several surface components
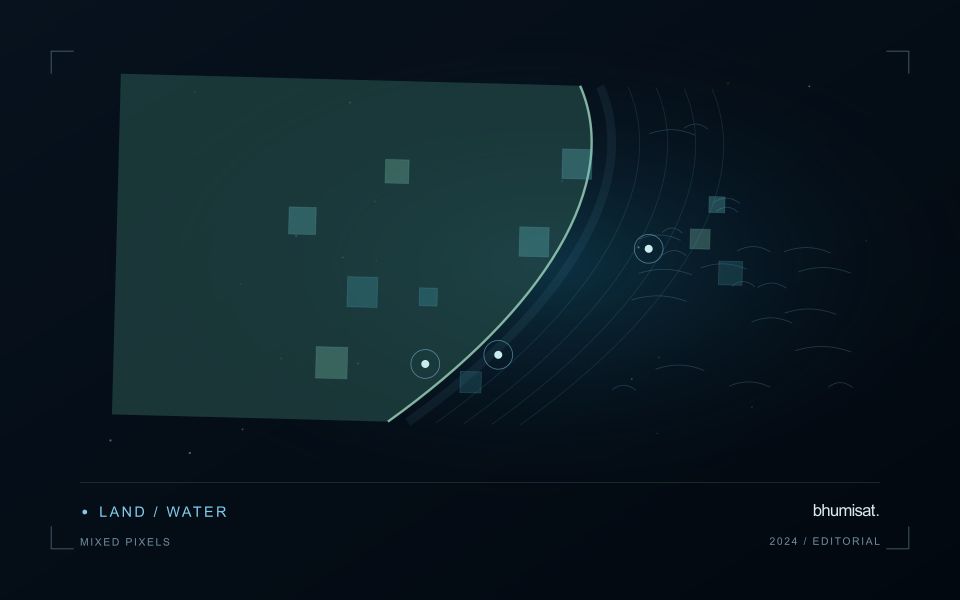
A satellite pixel represents an observation over a ground area, influenced by the instrument's spatial response and the scene within it. That area may contain several materials, such as crop canopy, soil, shade, water or a road. A mixed response is therefore common, especially near boundaries and in fragmented landscapes. It should not be treated automatically as a processing defect. The analytical question is whether the mixture supports the intended interpretation and whether a model trained under one mixture remains applicable under another.
Field geometry affects the number and character of observations available. A compact large field can contain many interior pixels, while a narrow or irregular field may consist mostly of boundary observations. Simply counting pixels does not establish how much independent information a dataset provides. Resampling onto a finer grid also does not remove the original mixing. Before selecting a monitoring product, examine the relationship between field dimensions, relevant landscape features and the measured spatial characteristics of the imagery that will support the service.
Choose a reporting unit that the data can support
Boundary exclusions can help investigate sensitivity to neighbouring surfaces, but they need a consistent rule and a clear purpose. Excluding a fixed distance may remove much of a small field while leaving a substantial interior in a larger one. Report the area retained and consider whether the remaining pixels represent the management unit fairly. Compare full-field and interior summaries during method development. A large difference can reveal a boundary or mixture problem that deserves attention before an alert is presented as a crop condition.
Validation should use observations collected at a scale compatible with the satellite interpretation. A measurement from a single plant or a small isolated plot may not describe the larger mixed area observed from orbit. Document the spatial support of both datasets and consider stratified sampling across relevant components. If the application requires information finer than the data can support, seek a suitable complementary source or change the question. Recognising mixed pixels helps an analyst design a credible product instead of assigning field-level precision to an observation that contains several different surfaces.
Prioritise alerts using evidence and consequence
An alert is a request for attention, so its design should consider both the evidence available and the cost of responding. Begin by distinguishing a measured change, a proposed interpretation, and the action expected from the recipient. A large numerical difference is not automatically the most urgent case. The significance of the location, the age of the observation, the confidence in the interpretation, and the consequences of delay can all influence priority.
Create a review queue with enough context to support consistent decisions. Useful information can include the supporting dates, quality qualifications, previous observations, geographic unit, and the reason the case entered the queue. Define when an alert can be closed, escalated, or held for another observation. A documented rule is easier to improve than an informal practice that depends entirely on the memory of the operator reviewing the result.
Collect feedback from inspections and operational responses. Record alerts that led to a useful finding, alerts that required no action, and important conditions that the system failed to flag. Review these outcomes across different settings rather than relying only on a total count of alerts. The objective is a queue that directs limited attention towards meaningful decisions, while generating evidence for adjusting thresholds, improving context, and reducing repeated sources of unnecessary work.
Design an evaluation that reflects deployment
A model evaluation should resemble the conditions in which the model will be used. Start by identifying which relationships the development data share: nearby locations, repeated observations of the same unit, common collection teams, or measurements from a single period. These relationships can make records less independent than they appear. An evaluation that ignores them may test the ability to recognise familiar conditions rather than the ability to operate in a new setting.
Choose a split strategy that matches the intended transfer. Holding out locations, seasons, operational units, or acquisition conditions can answer different questions. Document which question each split is designed to address, and keep the held-out evidence separate while selecting features and tuning the method. Repeatedly inspecting the same evaluation set to improve a model gradually makes that set part of development, even if it retains its original label.
Report results at a scale that is meaningful to the user. A strong average can hide poor performance for important subgroups or unusual conditions. Examine error patterns and retain examples of both successful and unsuccessful predictions. Where the evidence covers only a limited range of conditions, describe that range explicitly. The evaluation then becomes a practical guide to suitable use, further testing, and the collection of additional reference observations.
Bring the evidence back to the decision
A strong interpretation states what was observed, which explanations remain plausible, and what additional evidence would help distinguish them. Avoid presenting a convenient label as a confirmed cause when the measurements support only a broader pattern. Connect the proposed next step to the significance of the decision and the confidence available. This creates an interpretation that a field team, analyst, or project partner can examine, challenge, and improve as further observations become available.
Sources & further reading
Explore the bhumisat spacecraft concept and our vision towards 2030, or return to the journal.