Remote observations show patterns, while practical decisions depend on explaining what those patterns could mean. Interpretation therefore requires more than locating a high or low value on a map. A useful analysis considers the timing of the observation, the physical processes that influence the measurement, and the information available from complementary sources. This perspective separates an observed signal from a proposed explanation and from an action recommended to a user. Keeping those stages distinct makes it easier to investigate alternative causes, communicate ambiguity, and choose a proportionate next step.
This working guide considers rgb satellite imagery for field interpretation across sediment-runoff catchments. The immediate decision is to connect sampling priorities across land and water. Useful reference evidence includes timed water samples, runoff context and land-cover observations. The case is an illustrative planning context, with assumptions to check against the actual sensor, landscape and project requirements.
The setting: Sediment-runoff catchments
A catchment monitoring project connects land-cover patterns, drainage pathways and observations of receiving waters. These evidence streams operate at different spatial and temporal scales. A bare land patch or a bright water plume may be relevant to a sampling question, but an image alone does not establish that one caused the other. Define whether the task is mapping potential source areas, tracking a visible water pattern or evaluating a particular sediment-related variable.
Maintain suitable land and water masks and compare acquisitions with their rainfall and flow context where that information is available. Clouds can obscure the period of greatest interest, and conditions may change rapidly after runoff events. Land adjacency, shallow water and surface reflections can also affect optical interpretation. A useful monitoring record identifies the dates and valid areas supporting each observation instead of presenting a continuous causal story across missing measurements.
Field validation should collect water measurements with clear location, timing and sampling methods, alongside the evidence used to describe land conditions. Sampling only the most obvious plume may overlook other parts of the response or ordinary background variation. More specific source attribution needs an investigation designed for that claim. A practical first product can organise catchment observations and prioritise coordinated sampling, while keeping remotely observed associations distinct from explanations established through additional measurements.
Use visible context carefully
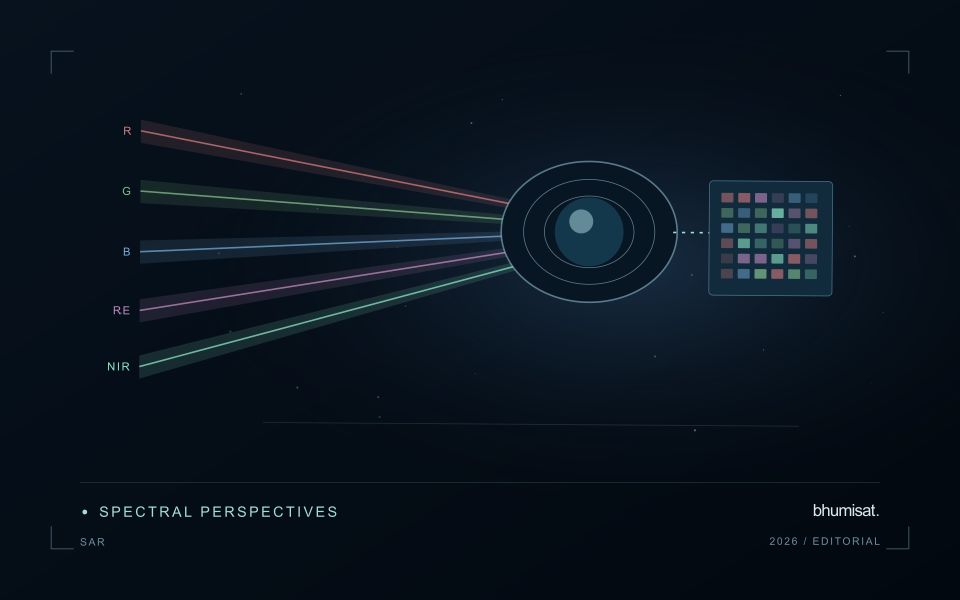
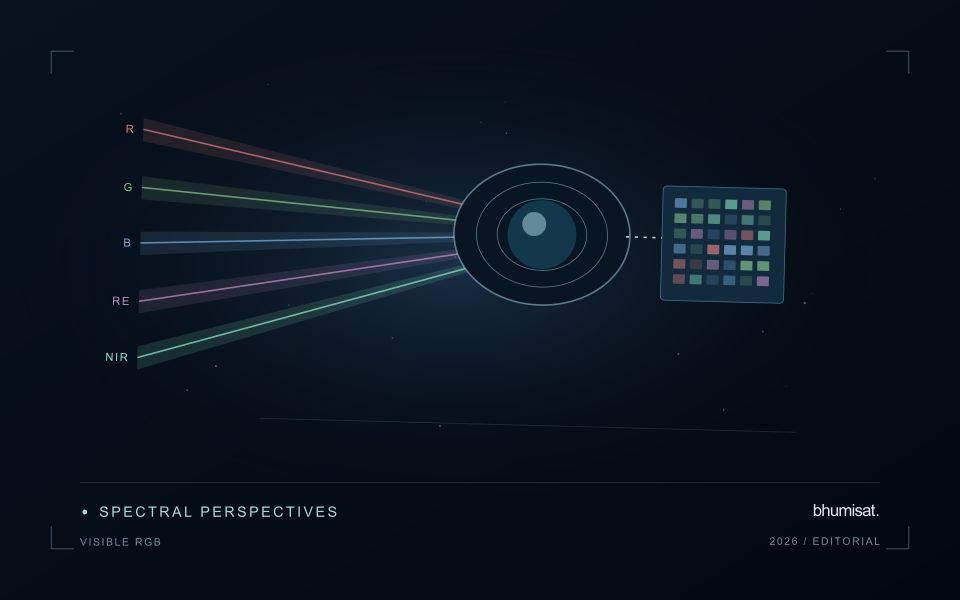
A familiar colour image combines red, green and blue measurements into a display that resembles human visual experience. That familiarity helps people recognise fields, roads, exposed soil, water and settlement patterns. It can also create a false sense that interpretation is effortless. Satellite imagery is influenced by acquisition conditions, processing and display choices. The image may not show the same colours an observer would have seen from the ground. Its value lies in spatial context, supported by a clear account of how the display was produced.
Contrast stretching makes subtle patterns easier to see, but it can make two dates look different even when the underlying reflectance is similar. An automatic stretch selected separately for each image is useful for exploration and less suitable as evidence of a measured change. Keep acquisition dates visible and distinguish a display adjustment from an analytical transformation. When comparing scenes, use a consistent viewing approach and inspect the original values or a suitable quantitative product before drawing a conclusion from colour alone.
Prepare a repeatable visual review
Visible imagery supports a practical first review of a monitoring result. Check whether a field boundary follows the current cultivated area and whether paths, buildings or neighbouring vegetation are included accidentally. Look for management changes that may explain a spectral anomaly, such as harvest, replanting or newly exposed ground. A visual check can identify a plausible explanation and guide field inspection. It should not be presented as proof of a specific disease, nutrient deficiency or production outcome without evidence suited to that claim.
A repeatable review protocol records what the analyst examined and how confidently it could be interpreted. The record can include cloud and shadow presence, obvious mapping errors, the age of the image and any feature requiring confirmation. Use agreed descriptions so that different reviewers can compare their findings. Where a detail is smaller than the available spatial information, acknowledge that limitation and seek a complementary observation. RGB imagery is a useful interface between technical analysis and field knowledge when its visual clarity is accompanied by disciplined interpretation.
Match coastal observations with changing conditions
Coastal observations can be influenced by conditions that change within a day as well as across seasons. The meaning of an image or reference measurement may depend on water level, currents, recent weather, and the state of the surrounding land. Begin by documenting the exact acquisition time and the contextual records relevant to the question. A comparison based only on calendar dates can conceal differences that are important to interpretation.
Define which conditions need to be comparable across observations. A shoreline analysis, an intertidal habitat study, and an investigation of water appearance can require different timing assumptions. Select reference locations and measurement procedures that address the specific application. Preserve information about observation depth, sampling position, and the duration represented by a reference measurement where those details affect the comparison.
Review apparent differences against the physical and observational context before assigning a cause. A change in visible extent or spectral response may reflect the state of the water and atmosphere as well as a change in the feature being studied. Where suitable contextual information is unavailable, qualify the comparison or use additional observations to test competing explanations. A dependable coastal workflow makes its timing assumptions explicit and preserves the information needed to reconsider them when further evidence becomes available.
Translate the decision into observation requirements
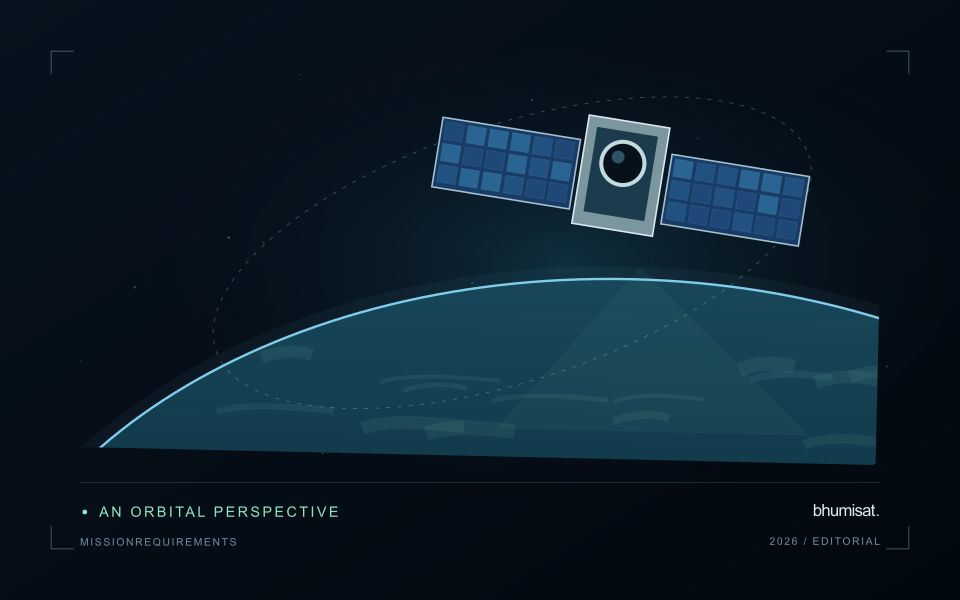
Start with the decision that the information is intended to support. Describe the geographic unit, the time available for acting, and the consequence of an incorrect interpretation. A requirement such as detecting an unusual pattern across management blocks is different from identifying its cause. Keeping that distinction explicit helps a team select measurements that are relevant to the application and prevents later evaluation from drifting towards whatever result happens to be easiest to demonstrate.
Build a compact requirements matrix linking each decision to the evidence needed, the proposed observation source, and an acceptance condition. Include geographic accuracy, temporal relevance, quality screening, and the context required for interpretation. The matrix should also identify the evidence used to justify each requirement. An engineering preference or a convenient data source can inform a study, but neither should silently replace a documented information need.
Review the matrix with the people who will use the result. Ask how their response would change when information is delayed, incomplete, or uncertain. Record unresolved requirements as questions for a pilot rather than converting them into confident specifications. This produces a practical framework for comparing technical options, designing tests, and explaining why an observation is useful to the intended workflow.
Bring the evidence back to the decision
A strong interpretation states what was observed, which explanations remain plausible, and what additional evidence would help distinguish them. Avoid presenting a convenient label as a confirmed cause when the measurements support only a broader pattern. Connect the proposed next step to the significance of the decision and the confidence available. This creates an interpretation that a field team, analyst, or project partner can examine, challenge, and improve as further observations become available.
Sources & further reading
Explore the bhumisat spacecraft concept and our vision towards 2030, or return to the journal.