Every observation and interpretation contains uncertainty, but the sources and consequences of that uncertainty differ between applications. Some arise from acquisition conditions, others from reference measurements, processing choices, or the transfer of a model to a new setting. This perspective examines how those sources affect the decision a user is considering. It encourages teams to describe uncertainty in a form that can influence action, rather than adding a generic qualification at the end of a report. The objective is to support proportionate decisions while keeping the limits of the available evidence understandable.
This working guide considers rgb satellite imagery for field interpretation on mountain forest slopes. The immediate decision is to select terrain-aware forest inspection sites. Useful reference evidence includes slope setting, canopy observations and reliable sample locations. The case is an illustrative planning context, with assumptions to check against the actual sensor, landscape and project requirements.
Use visible context carefully
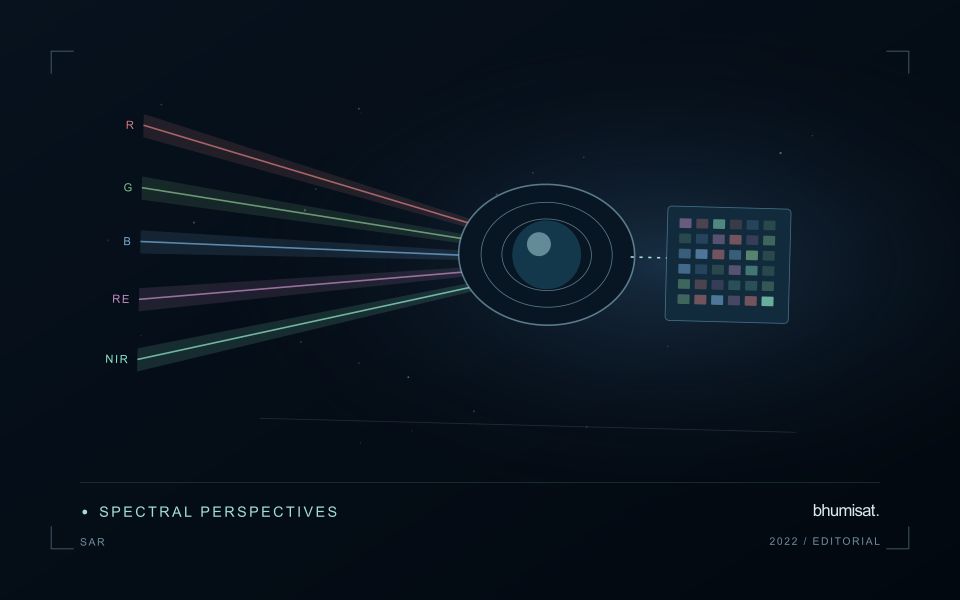
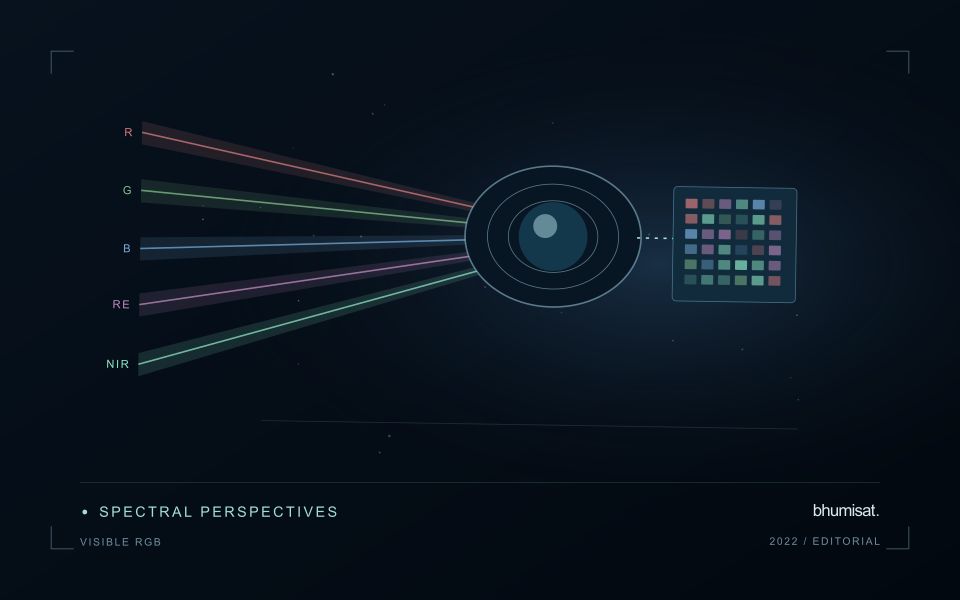
A familiar colour image combines red, green and blue measurements into a display that resembles human visual experience. That familiarity helps people recognise fields, roads, exposed soil, water and settlement patterns. It can also create a false sense that interpretation is effortless. Satellite imagery is influenced by acquisition conditions, processing and display choices. The image may not show the same colours an observer would have seen from the ground. Its value lies in spatial context, supported by a clear account of how the display was produced.
Contrast stretching makes subtle patterns easier to see, but it can make two dates look different even when the underlying reflectance is similar. An automatic stretch selected separately for each image is useful for exploration and less suitable as evidence of a measured change. Keep acquisition dates visible and distinguish a display adjustment from an analytical transformation. When comparing scenes, use a consistent viewing approach and inspect the original values or a suitable quantitative product before drawing a conclusion from colour alone.
Prepare a repeatable visual review
Visible imagery supports a practical first review of a monitoring result. Check whether a field boundary follows the current cultivated area and whether paths, buildings or neighbouring vegetation are included accidentally. Look for management changes that may explain a spectral anomaly, such as harvest, replanting or newly exposed ground. A visual check can identify a plausible explanation and guide field inspection. It should not be presented as proof of a specific disease, nutrient deficiency or production outcome without evidence suited to that claim.
A repeatable review protocol records what the analyst examined and how confidently it could be interpreted. The record can include cloud and shadow presence, obvious mapping errors, the age of the image and any feature requiring confirmation. Use agreed descriptions so that different reviewers can compare their findings. Where a detail is smaller than the available spatial information, acknowledge that limitation and seek a complementary observation. RGB imagery is a useful interface between technical analysis and field knowledge when its visual clarity is accompanied by disciplined interpretation.
The setting: Mountain forest slopes
A mountain forest combines canopy complexity with strong changes in slope, aspect and illumination. Locations that contain similar vegetation may appear different because they are observed under different lighting conditions. A monitoring design should therefore consider terrain alongside its ecological question. Define whether it concerns cover change, disturbance or a particular forest parameter, and establish comparison units that do not confuse a shadowed slope with a different type or condition of forest.
Image selection and processing should retain the information needed to examine these effects. Cloud, terrain shadow and changing viewing geometry can limit the usable record in different ways. A detailed elevation model may help describe the setting, but its resolution and alignment also need consideration. Review boundary areas and narrow valleys carefully, where mixed surfaces or small spatial offsets can have a large influence on an apparent change.
Field observations should represent the range of terrain settings in which the monitoring result will be used. Convenient valley access points may not characterise conditions on upper slopes. Record the location, slope context, canopy structure and date of each sample, along with uncertainty in locating it. A successful interpretation should remain defensible across the relevant terrain range. Where that has not been demonstrated, present the observation as a terrain-aware inspection lead rather than a fully validated forest measurement.
Keep an auditable review record
A review record should explain how a result moved from an analytical output to an accepted interpretation or operational decision. Preserve the product identifier, the evidence considered, the reviewer role, and the outcome of the review. A short, consistent record is often more useful than an extensive free-text note that cannot be compared between cases. The objective is to make important decisions traceable without turning routine review into unnecessary administrative work.
Separate observations from conclusions within the record. Describe the evidence visible to the reviewer, the alternative explanations considered where relevant, and the reason for accepting, qualifying, or rejecting the result. If a correction is required, identify what should change and how the revised product relates to the earlier version. Keep unresolved questions visible so that they can be addressed by another observation or by the person responsible for the next action.
Use the accumulated record to improve the workflow. Recurring review reasons can reveal unclear requirements, missing contextual information, unstable processing steps, or an evaluation gap. Examine whether similar cases receive similar decisions across reviewers and over time. Preserve the relationship between feedback and subsequent revisions so that improvements can be assessed against the evidence that motivated them. An auditable record supports learning, accountability, and consistent delivery while allowing the technical process to evolve.
Prioritise alerts using evidence and consequence
An alert is a request for attention, so its design should consider both the evidence available and the cost of responding. Begin by distinguishing a measured change, a proposed interpretation, and the action expected from the recipient. A large numerical difference is not automatically the most urgent case. The significance of the location, the age of the observation, the confidence in the interpretation, and the consequences of delay can all influence priority.
Create a review queue with enough context to support consistent decisions. Useful information can include the supporting dates, quality qualifications, previous observations, geographic unit, and the reason the case entered the queue. Define when an alert can be closed, escalated, or held for another observation. A documented rule is easier to improve than an informal practice that depends entirely on the memory of the operator reviewing the result.
Collect feedback from inspections and operational responses. Record alerts that led to a useful finding, alerts that required no action, and important conditions that the system failed to flag. Review these outcomes across different settings rather than relying only on a total count of alerts. The objective is a queue that directs limited attention towards meaningful decisions, while generating evidence for adjusting thresholds, improving context, and reducing repeated sources of unnecessary work.
Bring the evidence back to the decision
Useful uncertainty communication identifies the limitation, explains how it could affect the result, and connects it to a practical response. Some decisions can proceed with a qualified estimate; others require another observation or an independent check. Preserve uncertainty information through processing and delivery so that it is available at the point of use. This makes the analysis more accountable and gives the team a clearer basis for deciding which additional evidence would most improve the outcome.
Sources & further reading
Explore the bhumisat spacecraft concept and our vision towards 2030, or return to the journal.