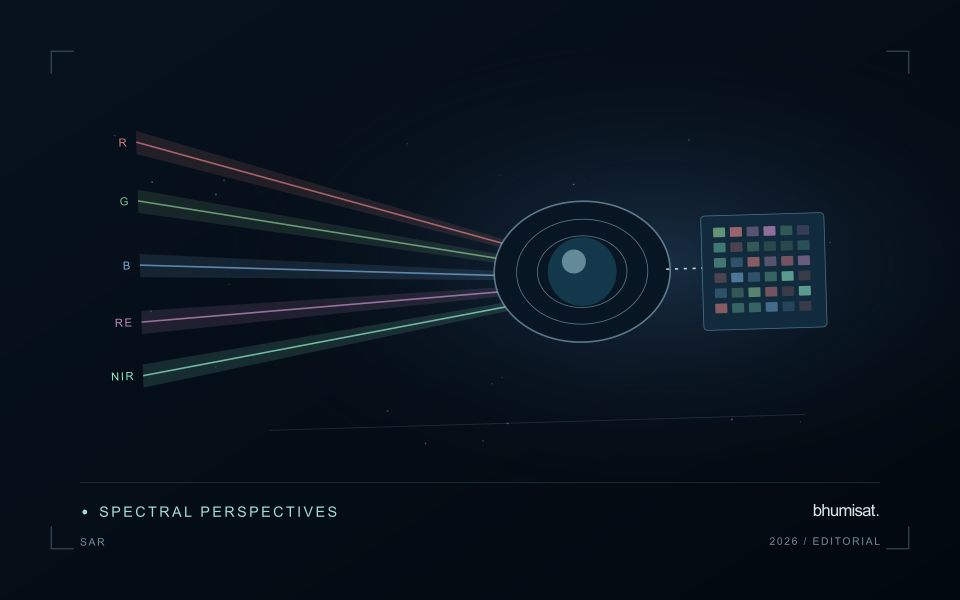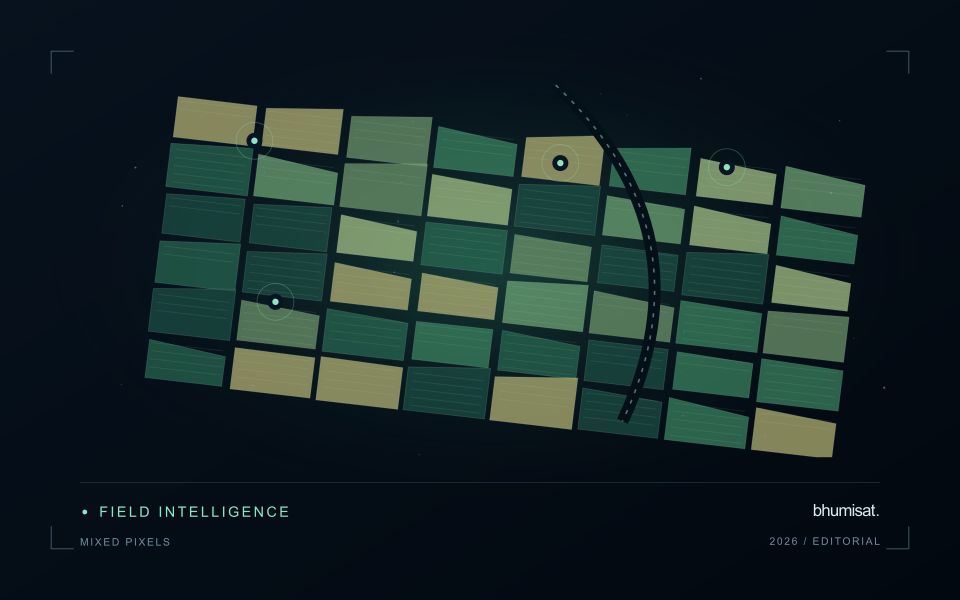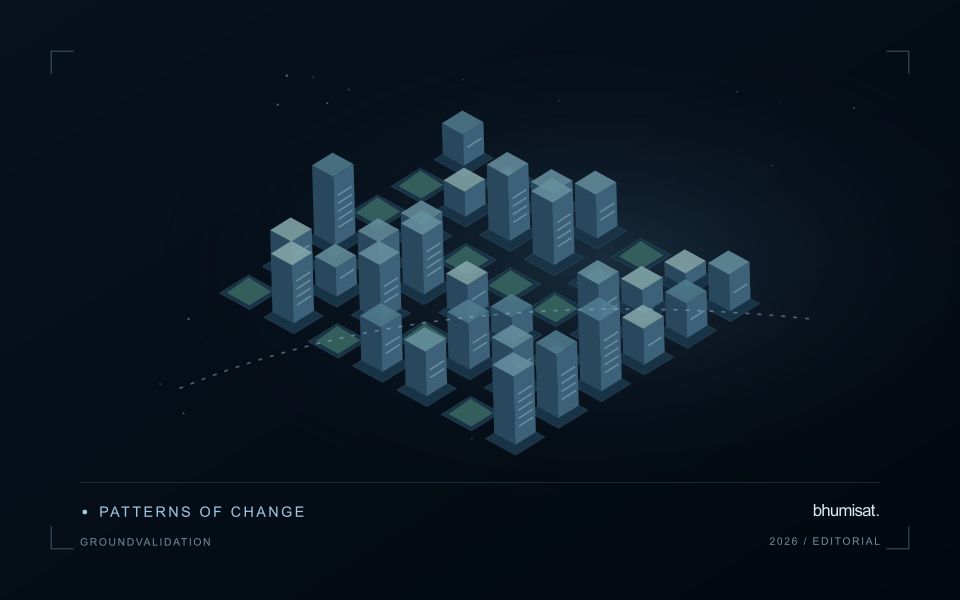
Comparisons through time are valuable only when the observations are sufficiently comparable for the question being asked. A difference between dates can reflect real change, a normal stage in a seasonal cycle, or a difference in how the surface was observed. This perspective examines the reference period, the timing of acquisitions, and the contextual records needed to interpret a sequence. It encourages the use of appropriate baselines rather than treating every previous observation as an equivalent benchmark. The objective is to identify changes that remain meaningful after normal variation and measurement conditions are considered.
This working guide considers reading uncertainty in remote sensing products over inland reservoir waters. The immediate decision is to select water-sampling locations. Useful reference evidence includes water samples, acquisition timing and reservoir-level context. The case is an illustrative planning context, with assumptions to check against the actual sensor, landscape and project requirements.
Identify what the uncertainty describes
A satellite product is the result of a measurement chain, rather than a direct copy of conditions on the ground. Detector noise, calibration, atmospheric correction, geolocation and retrieval assumptions can all affect the final value. Their importance changes with the target. A small location error may matter greatly beside a narrow river, while an imperfect aerosol correction may dominate a water reflectance estimate.
Start by reading the variable definition, units, spatial support and quality documentation. An uncertainty layer may describe an estimated standard deviation, a confidence interval, disagreement among models or another quantity entirely. These measures are not interchangeable. A model's class probability also does not automatically represent a calibrated probability that its label is correct. Check how the quantity was obtained and whether it has been evaluated against independent observations.
Carry uncertainty into the decision
Separate systematic differences from random variation. Averaging many observations can reduce independent random noise, but it does not remove a shared calibration bias. Nearby pixels and repeated observations may share errors, so treating every value as independent can produce confidence intervals that are too narrow. When comparing dates, consider whether the same processing method, sensor characteristics and environmental conditions apply.
Quality flags identify conditions that deserve screening or special treatment. They may indicate clouds, saturation, poor retrieval geometry or inputs outside a method's tested range. Preserve the original flags and record the filtering rule. A strict mask can improve reliability while leaving a sample that overrepresents clear weather or easier terrain. Report missing coverage alongside the measurements that remain.
For a practical assessment, perturb influential inputs within defensible ranges and examine how the result changes. Compare alternative valid processing choices, stratify errors by landscape or season and use independent reference data. Classification summaries should include class specific errors rather than relying on one overall accuracy figure. For continuous estimates, examine bias and the distribution of residuals as well as an aggregate error statistic. A useful final product states the tested domain, describes meaningful limitations and shows whether the uncertainty is small enough for the intended decision.
The setting: Inland reservoir waters
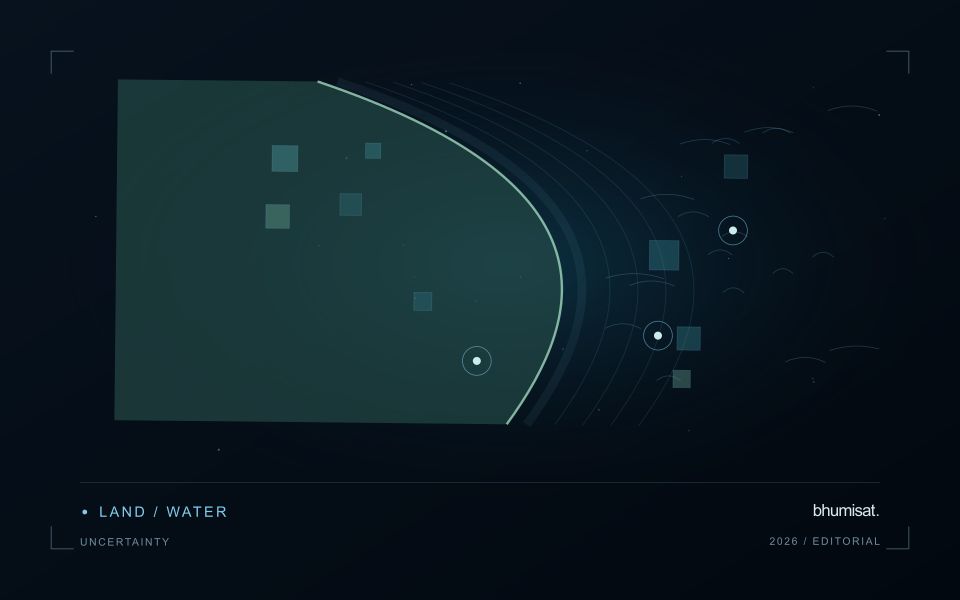
A reservoir image records water alongside shorelines, shallow areas, vegetation and surrounding land. The mixture visible at its margins changes as water level varies. A monitoring programme should distinguish mapping water extent from estimating a particular water-quality variable. These tasks may share observations, but they require different reference data and different rules for excluding surfaces that do not represent the open water of interest.
Optical interpretation depends on atmospheric conditions, surface reflections and the substances influencing the water signal. A bright patch could have several explanations, so an image feature should be treated as a question for investigation unless its relationship with a defined variable has been evaluated. Review clouds, shadows, sun glint and adjacency to bright land. Sampling footprints near a shoreline may need separate treatment because their measurements can include both land and water.
Field validation should connect each water sample to its location, collection time and the conditions relevant to the acquisition. A sample taken after a major change in inflow may not represent what the satellite observed earlier. Include different parts of the reservoir and the range of conditions expected in use. The final product should communicate whether it shows a spectral pattern, a calibrated estimate or a confirmed sampling result, rather than presenting those forms of evidence as identical.
Match coastal observations with changing conditions
Coastal observations can be influenced by conditions that change within a day as well as across seasons. The meaning of an image or reference measurement may depend on water level, currents, recent weather, and the state of the surrounding land. Begin by documenting the exact acquisition time and the contextual records relevant to the question. A comparison based only on calendar dates can conceal differences that are important to interpretation.
Define which conditions need to be comparable across observations. A shoreline analysis, an intertidal habitat study, and an investigation of water appearance can require different timing assumptions. Select reference locations and measurement procedures that address the specific application. Preserve information about observation depth, sampling position, and the duration represented by a reference measurement where those details affect the comparison.
Review apparent differences against the physical and observational context before assigning a cause. A change in visible extent or spectral response may reflect the state of the water and atmosphere as well as a change in the feature being studied. Where suitable contextual information is unavailable, qualify the comparison or use additional observations to test competing explanations. A dependable coastal workflow makes its timing assumptions explicit and preserves the information needed to reconsider them when further evidence becomes available.
Use observation labels with consistent meanings
A reference label should describe an observation that another person could recognise or reproduce. Broad terms such as good, damaged, or unusual can conceal substantial differences between collection teams. Begin by defining the feature or condition being recorded, the observation unit, and the evidence needed to assign a label. Where possible, distinguish a direct measurement from an interpretation made by the observer.
Provide a short collection guide with examples, boundary cases, and a way to record uncertainty. Train observers using shared cases before relying on independently collected labels. If two observers disagree, preserve the disagreement long enough to understand its cause. It may reveal an unclear definition, a genuinely ambiguous condition, a difference in observation scale, or a problem in matching the reference record to the remote measurement.
Retain the context that makes the label interpretable. Location, time, collection method, observer role, and relevant surface conditions can be essential for later review. Changes to the label scheme should be documented and related to earlier versions where a defensible correspondence exists. Consistent labels do not eliminate uncertainty, but they make it possible to investigate disagreement, evaluate analytical methods, and identify where better definitions or additional measurements would improve the evidence.
Bring the evidence back to the decision
A useful comparison preserves the dates, quality conditions, and contextual assumptions behind its baseline. Review unusual results against the actual observation sequence rather than relying entirely on a summary statistic. Where seasonal timing is important, describe how comparable stages were identified. The resulting analysis should help users distinguish an informative change from an expected cycle or an observation artefact, while making gaps and remaining uncertainty visible enough to guide further investigation.
Sources & further reading
Explore the bhumisat spacecraft concept and our vision towards 2030, or return to the journal.