A convincing image can still contain measurements that are unsuitable for a particular task. Quality control asks whether the inputs, transformations, and outputs meet the requirements of the intended application. This perspective follows evidence through the workflow, from acquisition metadata and reference observations to the final interpretation. It encourages teams to define acceptance conditions before seeing the result, rather than adjusting them to favour a preferred conclusion. The purpose is a repeatable way to distinguish usable observations, observations requiring qualification, and observations that should be excluded from a decision.
This working guide considers reading uncertainty in remote sensing products around aquaculture pond clusters. The immediate decision is to prioritise pond-cluster monitoring visits. Useful reference evidence includes pond boundaries, operation status and timed water measurements. The case is an illustrative planning context, with assumptions to check against the actual sensor, landscape and project requirements.
The setting: Aquaculture pond clusters
An aquaculture landscape contains ponds at different operating stages together with embankments, channels, roads and service areas. A satellite observation may support a pond inventory or a broader review of visible water patterns, but it should not be assumed to measure conditions within every individual production unit. Begin with boundaries and a record of pond status. Empty, recently filled and active ponds can have different appearances for ordinary operational reasons.
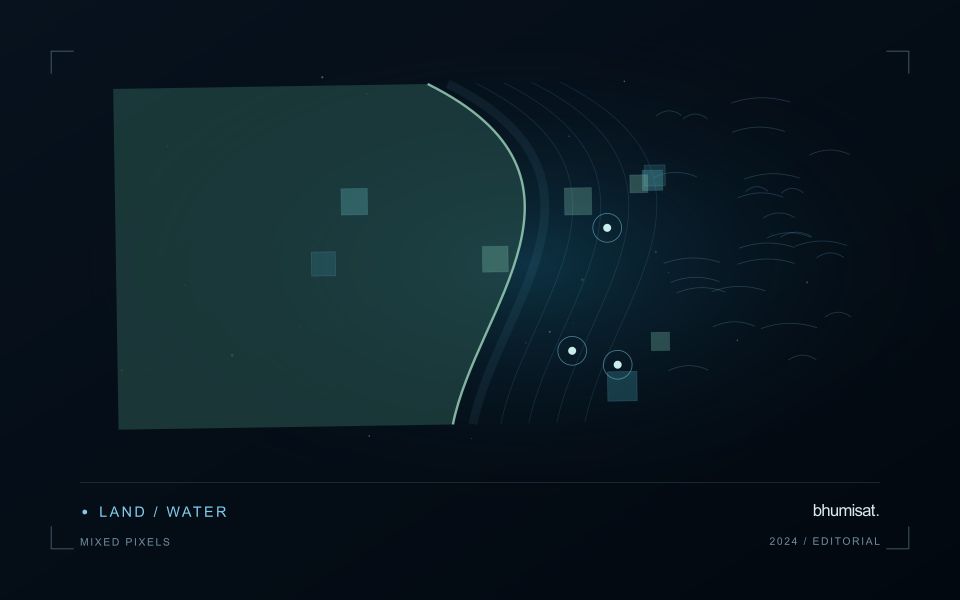
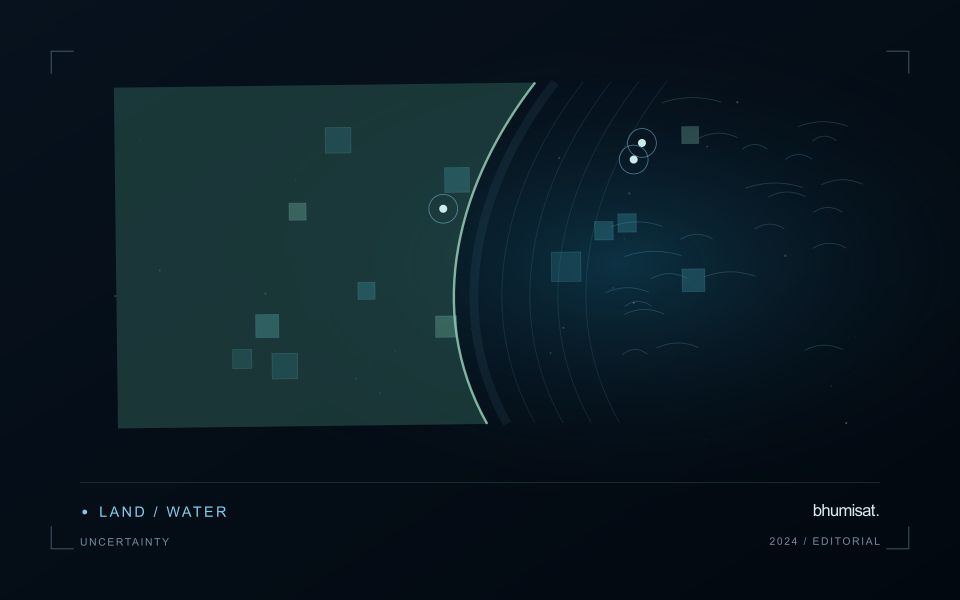
The size of a pond relative to the observation footprint determines how much embankment or neighbouring water contributes to a measurement. Review alignment and exclude unsuitable mixed areas where necessary. Surface reflections, cloud and atmospheric conditions can complicate optical comparison, while short-term management changes may occur between usable acquisitions. Retain observation dates and quality masks so that the image record does not imply continuous knowledge of rapidly changing pond conditions.
Validation should record the unit, collection time, operational context and the measurement method for any water variable being studied. A sample from one pond cannot automatically validate an adjacent pond or an entire cluster. A colour anomaly may help select a monitoring visit without establishing a particular biological condition or production outcome. More specific estimates require a demonstrated relationship with representative measurements, while inventory and inspection-priority products can be evaluated against the practical decisions they support.
Identify what the uncertainty describes
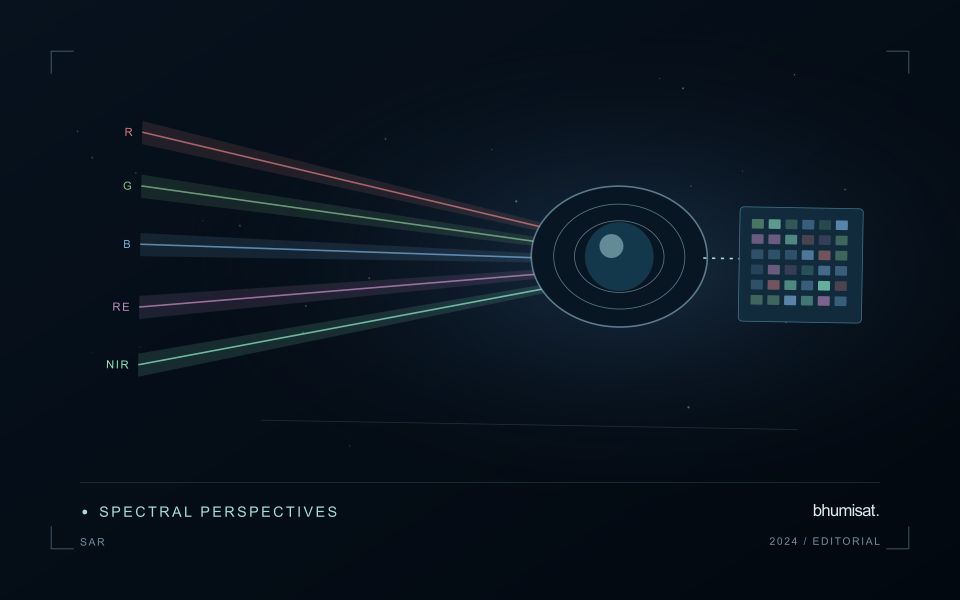
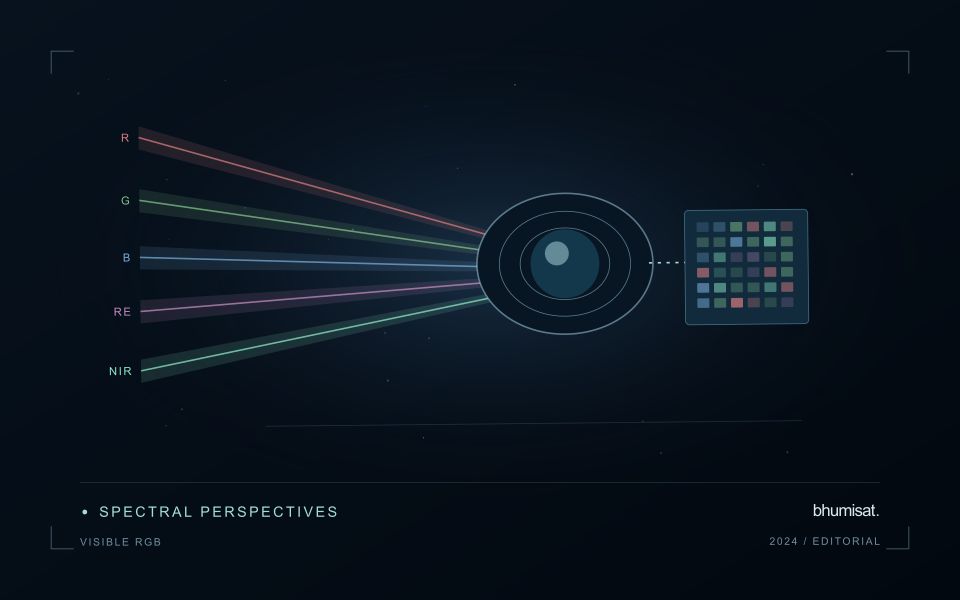
A satellite product is the result of a measurement chain, rather than a direct copy of conditions on the ground. Detector noise, calibration, atmospheric correction, geolocation and retrieval assumptions can all affect the final value. Their importance changes with the target. A small location error may matter greatly beside a narrow river, while an imperfect aerosol correction may dominate a water reflectance estimate.
Start by reading the variable definition, units, spatial support and quality documentation. An uncertainty layer may describe an estimated standard deviation, a confidence interval, disagreement among models or another quantity entirely. These measures are not interchangeable. A model's class probability also does not automatically represent a calibrated probability that its label is correct. Check how the quantity was obtained and whether it has been evaluated against independent observations.
Carry uncertainty into the decision
Separate systematic differences from random variation. Averaging many observations can reduce independent random noise, but it does not remove a shared calibration bias. Nearby pixels and repeated observations may share errors, so treating every value as independent can produce confidence intervals that are too narrow. When comparing dates, consider whether the same processing method, sensor characteristics and environmental conditions apply.
Quality flags identify conditions that deserve screening or special treatment. They may indicate clouds, saturation, poor retrieval geometry or inputs outside a method's tested range. Preserve the original flags and record the filtering rule. A strict mask can improve reliability while leaving a sample that overrepresents clear weather or easier terrain. Report missing coverage alongside the measurements that remain.
For a practical assessment, perturb influential inputs within defensible ranges and examine how the result changes. Compare alternative valid processing choices, stratify errors by landscape or season and use independent reference data. Classification summaries should include class specific errors rather than relying on one overall accuracy figure. For continuous estimates, examine bias and the distribution of residuals as well as an aggregate error statistic. A useful final product states the tested domain, describes meaningful limitations and shows whether the uncertainty is small enough for the intended decision.
Represent gaps without inventing observations
A monitoring sequence often contains periods without a usable observation. The reason may be cloud, shadow, missing coverage, a failed transfer, or a quality condition that excludes the data. Begin by representing these states explicitly. A missing observation is different from a low measurement, an unchanged surface, or a confirmed absence of the feature being studied. The distinction should survive both the analysis and the presentation of the result.
Define when a temporal gap is acceptable for the intended decision. A workflow may continue using the latest qualified observation, request another source, or suspend an alert until sufficient evidence is available. Whichever response is selected, show the age of the supporting observation. If interpolation is used for a suitable analytical purpose, preserve the distinction between an estimated value and a directly observed measurement, together with the assumptions needed to interpret it.
Review how gaps affect the coverage of the final evaluation. Locations with frequent missing data may differ systematically from those with regular observations. A performance estimate based only on clear, complete records can therefore describe a narrower population than the service is expected to support. Report usable coverage alongside analytical results and use recurring gaps to guide acquisition planning, reference collection, and the selection of complementary observation methods.
Match the timing of reference observations
The value of a reference measurement depends partly on how well its timing matches the observation being evaluated. A surface, crop, water body, or instrument state may change between the two measurements. Start by documenting the acquisition time of every source and the period over which the reference observation applies. Avoid treating a date entered during data upload as though it were necessarily the time when the measurement was collected.
Define an acceptable timing relationship for the application. A slowly changing structural feature may tolerate a broader comparison window than a rapidly changing surface condition. The window should be justified by the process being studied and by any available contextual records. If conditions change within that period, consider separating the observations into suitable groups rather than combining them under a single assumption of comparability.
Preserve information about interventions and events between observations. A management operation, rainfall episode, disturbance, or change in sensor configuration can alter the interpretation of a comparison. Record the event and decide whether the pair remains suitable for evaluation. Where the timing mismatch cannot be resolved, describe the comparison as qualified evidence. This is more informative than allowing an uncertain match to influence a performance statistic without explanation.
Bring the evidence back to the decision
Quality control is most useful when its results travel with the information being delivered. Preserve the reasons for accepting or rejecting an observation, and expose limitations that could change the user's interpretation. Review recurring failures as clues about the design of the workflow. A clear quality record supports consistent comparisons between operators and processing versions, while helping the team decide whether a problem originates in acquisition, preparation, interpretation, or the underlying observation requirements.
Sources & further reading
Explore the bhumisat spacecraft concept and our vision towards 2030, or return to the journal.