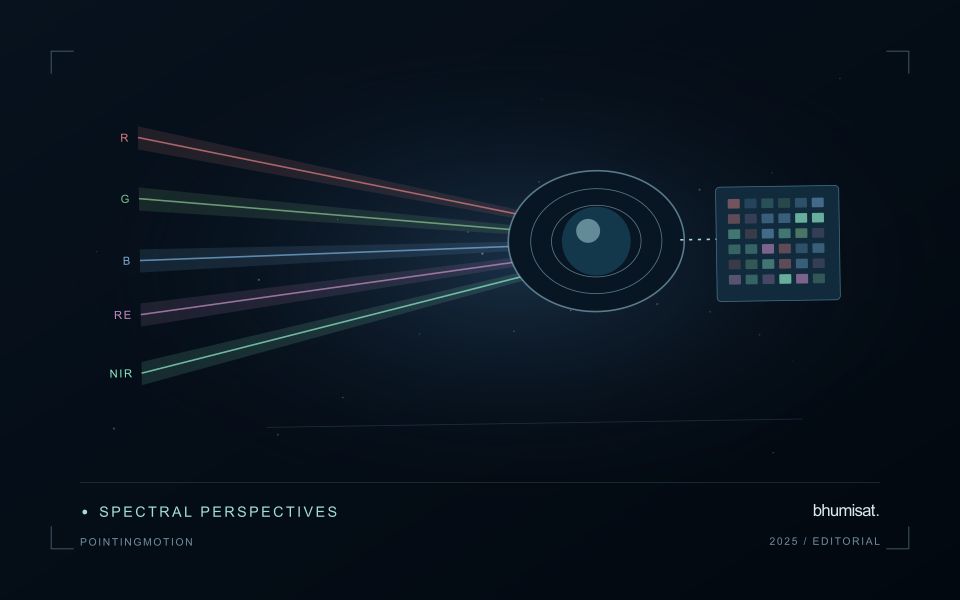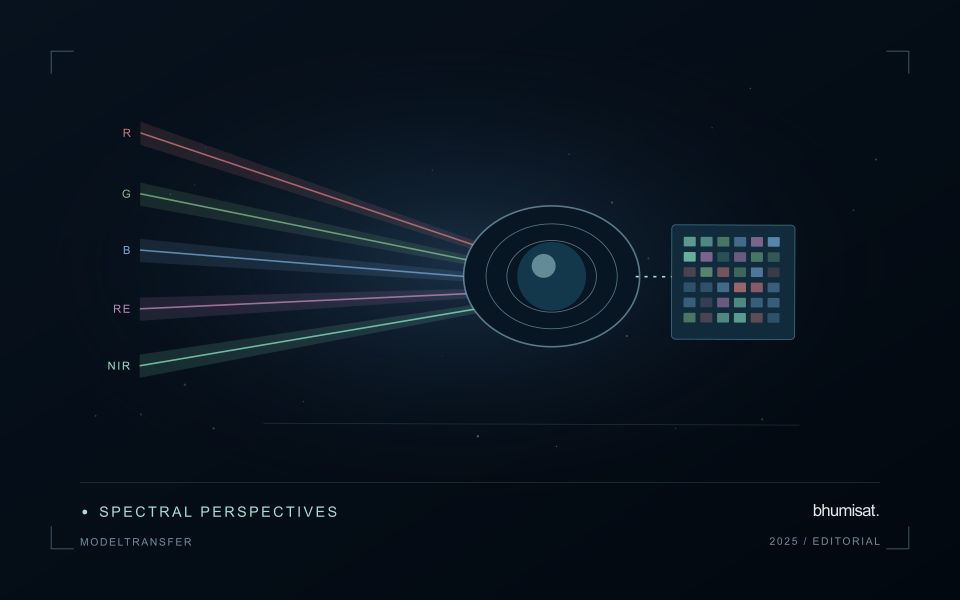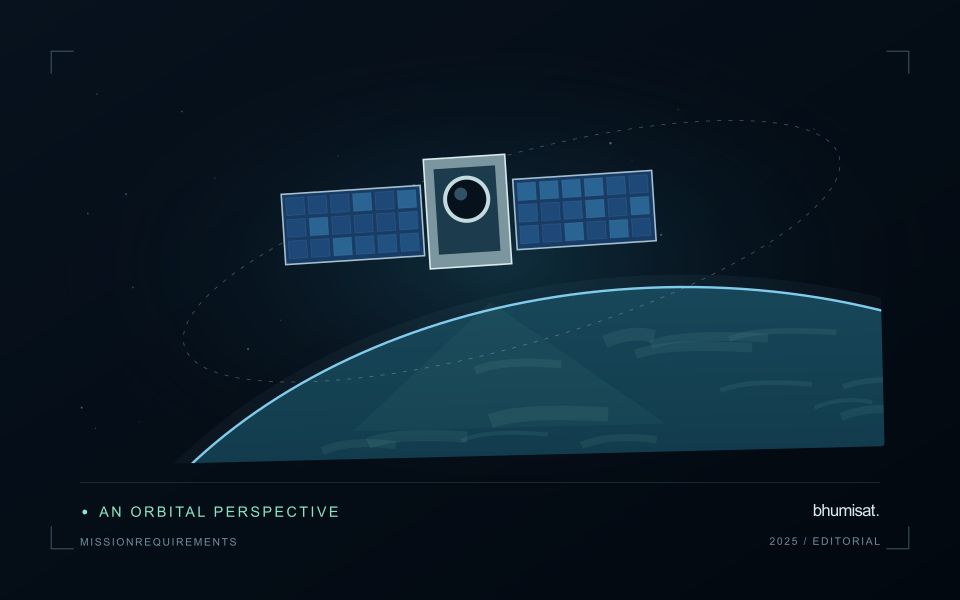
Comparisons through time are valuable only when the observations are sufficiently comparable for the question being asked. A difference between dates can reflect real change, a normal stage in a seasonal cycle, or a difference in how the surface was observed. This perspective examines the reference period, the timing of acquisitions, and the contextual records needed to interpret a sequence. It encourages the use of appropriate baselines rather than treating every previous observation as an equivalent benchmark. The objective is to identify changes that remain meaningful after normal variation and measurement conditions are considered.
This working guide considers building a spacecraft power and energy budget around energy infrastructure sites. The immediate decision is to review visible changes around infrastructure. Useful reference evidence includes site boundaries, operation context and dated field observations. The case is an illustrative planning context, with assumptions to check against the actual sensor, landscape and project requirements.
The setting: Energy infrastructure sites
An energy infrastructure site can combine buildings, equipment, access routes, vegetation, water and managed open land. A remote observation may be useful for reviewing visible changes around the site, but its interpretation depends on the feature and decision being studied. Mapping land-cover change, documenting surrounding vegetation and investigating a water pattern are separate objectives. Establish the site boundary and the relevant observation units before selecting analytical features or thresholds.
Large structures can introduce shadows and geometric effects, while narrow management zones may contain mixed observations. Review whether the image resolution supports the detail presented in the report. A change in nearby vegetation may follow normal maintenance, seasonal development or another land-use activity. Preserve the acquisition dates and any available operational context so that an observed pattern can be investigated without assigning an unsupported explanation to it.
Validation should describe the actual surface or feature observed and the spatial area represented by each record. Measurements inside the site and observations of its surroundings may answer different questions and should remain distinguishable. A satellite-derived alert can support a site review without establishing equipment performance or a particular operational condition. Evaluate whether the product provides relevant, interpretable evidence for the intended monitoring task, including instances where follow-up found that a visible change was expected or temporary.
Distinguish power from stored energy
A spacecraft electrical power system must generate energy, store it when necessary and distribute it reliably to the loads. Power describes the rate of energy use, while energy describes consumption over an interval. A transmitter may have a high instantaneous demand even if it operates briefly. Conversely, a modest continuous load can dominate the daily energy budget. Both views are needed to size the system.
List operating modes and their duration: standby, imaging, processing, communication, safe mode and any relevant transitions. Include heaters, power conversion losses and supporting electronics rather than counting only the camera and radio. Identify loads that overlap in time and those that can be scheduled separately. Peak current and startup behavior can challenge distribution hardware even when the average energy balance appears comfortable.
Check realistic orbit and lifetime conditions
Solar generation depends on illumination, array orientation, temperature and the condition of the cells and associated hardware. Eclipse intervals require stored energy, and imaging or communication pointing may reduce favorable Sun exposure. Evaluate the time sequence across representative orbits rather than comparing one average generation number with one average load. Consider the expected decline in performance over the mission and apply clearly justified design margins.
Battery sizing must consider usable capacity under the planned temperature, discharge rate and cycling conditions. Nominal capacity alone does not describe what is safely available in service. Charging limits, allowed depth of discharge, ageing and monitoring requirements influence the operating envelope. Thermal design and power planning therefore need to evolve together. A heater can protect a battery while consuming the energy that the battery is expected to deliver.
The distribution system should detect and isolate relevant faults while preserving essential functions. Define which loads are shed when energy becomes scarce and what conditions allow them to return. Safe mode needs its own verified energy balance and a credible path toward recovery. Telemetry should support comparison between predicted and measured generation, consumption and battery behavior. Test the budget with realistic duty cycles, instrument startup sequences and communication sessions, then update the model using measured component performance. A defensible power plan explains the worst cases and the assumptions behind its reserve, allowing observation schedules to be adjusted before they threaten spacecraft survival.
Validate land-cover transitions
A mapped change should describe a transition between meaningful surface states, not merely a difference between two classifications. Begin by defining the land-cover categories, the geographic unit, and the kinds of transition relevant to the application. Categories should be interpretable in the observations available at each date. A distinction that cannot be recognised consistently can create apparent change even when the underlying surface remains similar.
Evaluate the observations supporting both sides of the transition. Differences in acquisition conditions, geographic alignment, seasonal vegetation, shadows, or class definitions can influence the result. Review stable locations alongside apparent changes, and retain the source imagery or other evidence needed to investigate ambiguous cases. Where multiple changes occur within a geographic unit, describe how the workflow represents mixtures rather than forcing a single label that conceals important variation.
Use reference evidence that reflects the timing and scale of the claimed transition. A recent inspection may confirm the current surface without establishing when a previous condition changed. Historical imagery, dated records, and complementary observations can strengthen that sequence where available. Report uncertainty in the transition itself, including ambiguous starting or ending states. This produces a change product that users can examine as a documented account of land-cover evolution rather than an unexplained set of coloured differences.
Check spatial alignment before comparison
A comparison between images, channels, maps, or field measurements assumes that the observations refer to the same locations at a suitable level of precision. Small alignment errors can become especially important near boundaries or narrow features. Before interpreting differences, inspect whether identifiable, stable features agree between the sources. A common coordinate reference is necessary for many workflows, but it does not by itself demonstrate accurate alignment.
Use control features that are appropriate for the observation scale and remain stable across the comparison period. Evaluate alignment in more than one part of the area, because a single location cannot reveal spatially varying distortion. Record the method used to estimate any correction and retain independent features for checking the corrected result. Where surfaces have genuinely changed, avoid using those changes as evidence of an alignment error.
Propagate the implications of remaining misalignment into the analysis. A workflow may exclude boundary pixels, summarise at a broader scale, or qualify interpretations for small features. The choice should follow the application rather than a preference for visually smooth output. Preserve both the original and corrected geographic references, and document resampling decisions so that future users can understand how measurements were moved onto a common spatial framework.
Bring the evidence back to the decision
A useful comparison preserves the dates, quality conditions, and contextual assumptions behind its baseline. Review unusual results against the actual observation sequence rather than relying entirely on a summary statistic. Where seasonal timing is important, describe how comparable stages were identified. The resulting analysis should help users distinguish an informative change from an expected cycle or an observation artefact, while making gaps and remaining uncertainty visible enough to guide further investigation.
Sources & further reading
Explore the bhumisat spacecraft concept and our vision towards 2030, or return to the journal.