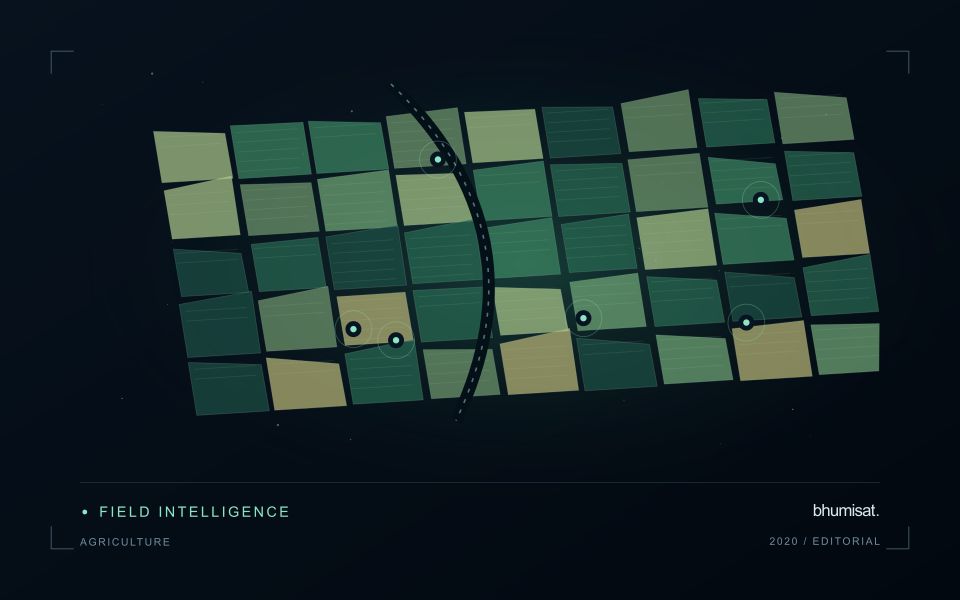
Satellite crop monitoring is most valuable when it helps a team decide where to look next. It can reveal variation across large agricultural areas, organise a growing season into a sequence of observations and highlight changes that merit investigation. Its value depends on the way those observations are selected and interpreted. An automated vegetation map is an analytical starting point, rather than a complete agronomic diagnosis.
This article uses 2020 as a retrospective focus within our Earth observation knowledge series. That year provides a useful setting for discussing the growing accessibility of satellite archives and the practical challenge of turning repeated imagery into dependable crop information. The workflow described here is an explanation of good practice, not a claim that bhumisat operated a satellite or delivered a particular commercial service in 2020.
What NDVI contributes to a monitoring workflow
The Normalized Difference Vegetation Index, or NDVI, compares near-infrared and red reflectance using the expression (NIR − Red) / (NIR + Red). The contrast between these measurements can help describe the presence and condition of green vegetation. NASA explains the physical relationship behind this widely used index. The calculation is simple, but its interpretation depends on the landscape and observation conditions. [1]
NDVI does not directly measure tonnes of harvested crop, identify every disease or determine a universal fertiliser requirement. A field with a different planting date can have a different index value while developing normally. A harvested field may produce a sharp decline that is entirely expected. Turning the index into a useful signal therefore requires crop information, seasonal context and a clear definition of the question.
Start with a field register
Before selecting images, establish which geographic units the service will monitor. A field register should include dependable boundaries, a unique identifier, commodity, planting information where available and the responsible operational team. These records connect the spatial analysis to an actual management process. Without them, a technically correct raster may still be difficult to use because nobody knows which action belongs to which location.
Boundary quality deserves attention in its own right. A polygon that accidentally includes a road, canal or neighbouring crop can change the summary statistics. Very narrow fields may contain little uncontaminated information at the selected image resolution. A useful system should identify such cases and explain the limitation, rather than presenting the same confidence level for every management unit.
Quality screening comes before change detection
Clouds and their shadows can create large apparent changes in optical imagery. Other conditions, such as haze, saturation or missing values, can also affect interpretation. Quality layers should be incorporated before calculating field summaries. USGS describes how Landsat surface-reflectance quality assessment information identifies observations that may be affected by atmospheric, surface or instrument conditions. [2]
A service can report the proportion of valid pixels used for each field and observation date. If only a small part of the field is visible, the resulting mean may be unrepresentative. When there is insufficient reliable coverage, it is often more useful to withhold the field score and show the reason. A visible data gap gives the operational team a sounder basis for planning than an apparently precise but poorly supported estimate.
Follow the crop through time
A time series places the latest observation within a sequence. The comparison should consider planting date, crop stage, management events and the availability of reliable imagery. For annual crops, it may be appropriate to align fields by days after planting. For perennial plantations, comparisons may also need to account for stand age, pruning, replanting and seasonal management practices.
Simple reference curves can be useful during an initial pilot. For example, a team could examine how a field compares with its own previously observed seasonal pattern. Such a comparison should preserve the underlying dates and acknowledge differences between seasons. A reference derived from one small pilot area should not automatically become a universal threshold across commodities, climates and management systems.
Use robust summaries and visible uncertainty
The mean vegetation index is an intuitive summary, but it can conceal important variation. A field may contain both vigorous and sparse areas that average to an ordinary-looking value. Depending on the task, the median, spread or proportion of pixels outside an expected range can provide additional information. These summaries are most helpful when the customer can inspect the spatial pattern behind the number.
Uncertainty should be communicated in terms relevant to the user. This might include limited valid coverage, a long interval since the previous clear observation or a mismatch between field size and image detail. A short quality note can prevent an operator from treating two superficially similar alerts as equally reliable. The purpose is to make the result easier to use responsibly, rather than to surround every observation with technical language.
Design an inspection rather than a diagnosis
Consider a hypothetical estate where several blocks show an unexpected decline relative to comparable fields. The monitoring output could identify the blocks, locate the strongest changes and suggest the supporting records that a field team should inspect. It should not automatically label the cause as disease or drought. Those explanations require additional evidence that may include local measurements and a trained agronomist's assessment.
An inspection form can capture the suspected cause, observed crop condition, photographs and management history. Recording the visit date is essential because conditions can change between satellite acquisition and field inspection. Teams should also record whether a recommended action was taken. This creates the evidence needed to evaluate the complete service, rather than only the apparent accuracy of an isolated map.
Validate across the conditions customers actually face
A useful validation sample covers different crop stages, field sizes and management conditions. It also includes observations that did not trigger an alert. This helps determine whether the system misses important events as well as whether it generates unnecessary visits. Sampling only conspicuously poor fields tends to produce an incomplete picture of performance and can encourage thresholds that work badly during routine operations.
Model evaluation should keep training and testing information appropriately separated. Nearby samples or repeated observations of the same field can be closely related. If they are divided without care, the reported test result may overstate performance on a new location or season. Designing the evaluation around the intended deployment conditions is an important part of building credible agricultural intelligence.
Connect the map to an operational outcome
The customer experience should end with an understandable action: inspect this block, verify a boundary, check an irrigation record or wait for a more reliable observation. A dashboard with many indices can overwhelm users if it leaves these decisions unresolved. It is usually better to make one clearly defined monitoring task reliable before expanding the product into a large collection of loosely connected indicators.
Operational evaluation can track the number of inspections completed, the proportion producing an actionable finding and the time required to investigate each alert. Financial or yield benefits need their own evidence and appropriate comparisons. An apparent association between an alert and a later harvest result does not, by itself, prove that the monitoring service caused an improvement.
Why the 2020 perspective still matters
In March 2020, USGS marked one hundred million Landsat downloads, illustrating the scale of interest enabled by open access to the archive. The milestone concerned data use, rather than a guarantee that every downloaded scene produced an operational benefit. The distinction is useful for anyone building a new monitoring service. Access is the beginning of a value chain that must still include interpretation and deployment. [3]
For bhumisat, these lessons support an application-led approach to future mission development. Existing satellite data can help test the observations needed for a crop-specific service, while field campaigns establish where those observations are meaningful. NDVI remains useful within that process when its limitations are understood and its results are connected to clear, validated decisions on the ground.
Sources & further reading
Explore the bhumisat spacecraft concept and our vision towards 2030, or return to the journal.