Comparisons through time are valuable only when the observations are sufficiently comparable for the question being asked. A difference between dates can reflect real change, a normal stage in a seasonal cycle, or a difference in how the surface was observed. This perspective examines the reference period, the timing of acquisitions, and the contextual records needed to interpret a sequence. It encourages the use of appropriate baselines rather than treating every previous observation as an equivalent benchmark. The objective is to identify changes that remain meaningful after normal variation and measurement conditions are considered.
This working guide considers red edge sensing for vegetation studies around aquaculture pond clusters. The immediate decision is to prioritise pond-cluster monitoring visits. Useful reference evidence includes pond boundaries, operation status and timed water measurements. The case is an illustrative planning context, with assumptions to check against the actual sensor, landscape and project requirements.
The setting: Aquaculture pond clusters
An aquaculture landscape contains ponds at different operating stages together with embankments, channels, roads and service areas. A satellite observation may support a pond inventory or a broader review of visible water patterns, but it should not be assumed to measure conditions within every individual production unit. Begin with boundaries and a record of pond status. Empty, recently filled and active ponds can have different appearances for ordinary operational reasons.
The size of a pond relative to the observation footprint determines how much embankment or neighbouring water contributes to a measurement. Review alignment and exclude unsuitable mixed areas where necessary. Surface reflections, cloud and atmospheric conditions can complicate optical comparison, while short-term management changes may occur between usable acquisitions. Retain observation dates and quality masks so that the image record does not imply continuous knowledge of rapidly changing pond conditions.
Validation should record the unit, collection time, operational context and the measurement method for any water variable being studied. A sample from one pond cannot automatically validate an adjacent pond or an entire cluster. A colour anomaly may help select a monitoring visit without establishing a particular biological condition or production outcome. More specific estimates require a demonstrated relationship with representative measurements, while inventory and inspection-priority products can be evaluated against the practical decisions they support.
Observe a transition, not a universal plant score
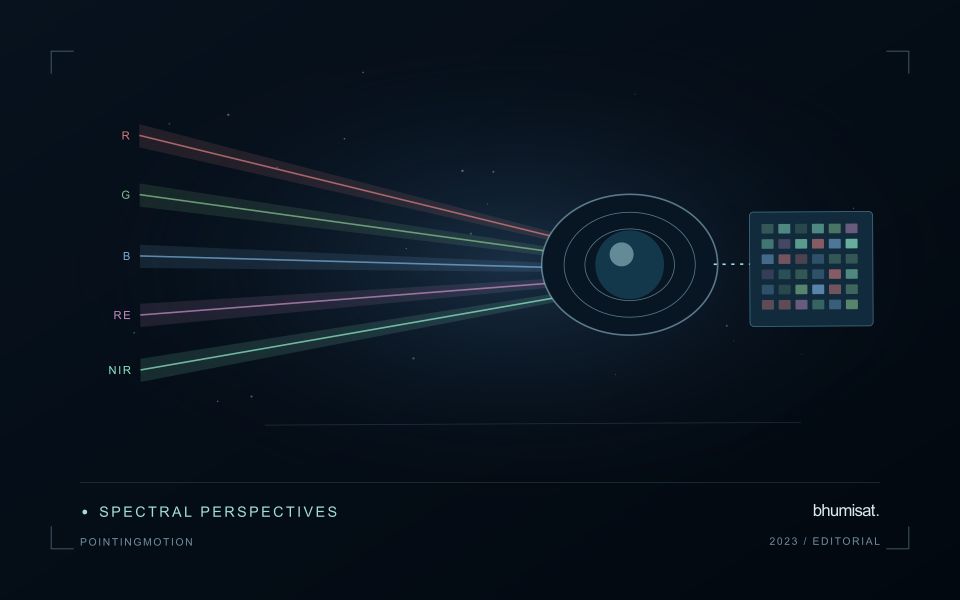
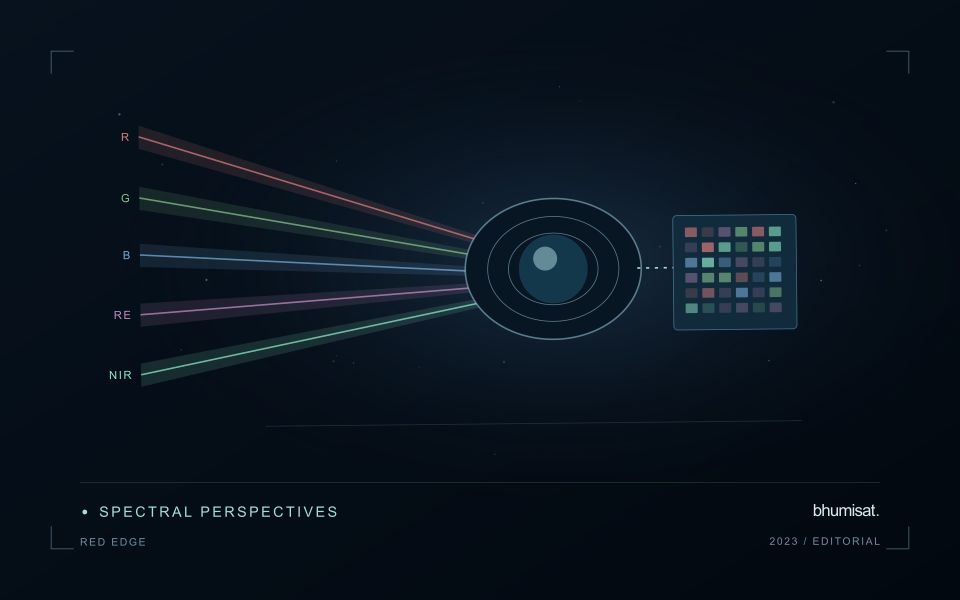
The Red Edge is a transition region in the spectral response of vegetation between visible red absorption and near-infrared reflectance. Measuring this region can add useful information to a vegetation study because different channels sample different parts of the transition. The phrase Red Edge is therefore a broad description rather than a complete instrument specification. A study needs the channel response, its bandwidth and its relationship to the other measurements used in the analysis. Those details influence what comparisons can be made reliably.
Leaf properties and the arrangement of leaves within a canopy both affect the signal reaching a satellite. The observed field also contains shadows, branches, soil and sometimes water or understory vegetation. Consequently, a relationship established with a leaf instrument cannot simply be assumed to hold at satellite-pixel scale. Scaling the interpretation requires observations that connect these levels. This distinction becomes especially important when the intended application concerns a specific biochemical parameter, because the image records a combined landscape response rather than an isolated leaf measurement.
Design the comparison around the instrument
Start an application study by identifying the information that an added Red Edge channel is expected to contribute. Compare that expectation with available data from established instruments and with a baseline method using fewer bands. Check whether any apparent improvement persists in independent fields and seasons. Use the same evaluation protocol for both methods. An instrument design decision should consider the improvement alongside calibration, alignment, signal quality and processing demands. More channels introduce more measurement opportunities and more relationships that must be understood.
For an ongoing service, retain enough metadata to trace every result to its source bands. A change in sensor, processing version or band selection can create a discontinuity in an otherwise plausible time series. Validate the transition rather than hiding it within a long historical chart. Clear documentation allows a user to distinguish a change in vegetation from a change in the observation system. Red Edge sensing becomes valuable when its additional spectral information can be linked to a defined application through repeatable measurements and independent evidence.
Check spatial alignment before comparison
A comparison between images, channels, maps, or field measurements assumes that the observations refer to the same locations at a suitable level of precision. Small alignment errors can become especially important near boundaries or narrow features. Before interpreting differences, inspect whether identifiable, stable features agree between the sources. A common coordinate reference is necessary for many workflows, but it does not by itself demonstrate accurate alignment.
Use control features that are appropriate for the observation scale and remain stable across the comparison period. Evaluate alignment in more than one part of the area, because a single location cannot reveal spatially varying distortion. Record the method used to estimate any correction and retain independent features for checking the corrected result. Where surfaces have genuinely changed, avoid using those changes as evidence of an alignment error.
Propagate the implications of remaining misalignment into the analysis. A workflow may exclude boundary pixels, summarise at a broader scale, or qualify interpretations for small features. The choice should follow the application rather than a preference for visually smooth output. Preserve both the original and corrected geographic references, and document resampling decisions so that future users can understand how measurements were moved onto a common spatial framework.
Match the timing of reference observations
The value of a reference measurement depends partly on how well its timing matches the observation being evaluated. A surface, crop, water body, or instrument state may change between the two measurements. Start by documenting the acquisition time of every source and the period over which the reference observation applies. Avoid treating a date entered during data upload as though it were necessarily the time when the measurement was collected.
Define an acceptable timing relationship for the application. A slowly changing structural feature may tolerate a broader comparison window than a rapidly changing surface condition. The window should be justified by the process being studied and by any available contextual records. If conditions change within that period, consider separating the observations into suitable groups rather than combining them under a single assumption of comparability.
Preserve information about interventions and events between observations. A management operation, rainfall episode, disturbance, or change in sensor configuration can alter the interpretation of a comparison. Record the event and decide whether the pair remains suitable for evaluation. Where the timing mismatch cannot be resolved, describe the comparison as qualified evidence. This is more informative than allowing an uncertain match to influence a performance statistic without explanation.
Bring the evidence back to the decision
A useful comparison preserves the dates, quality conditions, and contextual assumptions behind its baseline. Review unusual results against the actual observation sequence rather than relying entirely on a summary statistic. Where seasonal timing is important, describe how comparable stages were identified. The resulting analysis should help users distinguish an informative change from an expected cycle or an observation artefact, while making gaps and remaining uncertainty visible enough to guide further investigation.
Sources & further reading
Explore the bhumisat spacecraft concept and our vision towards 2030, or return to the journal.