Remote observations show patterns, while practical decisions depend on explaining what those patterns could mean. Interpretation therefore requires more than locating a high or low value on a map. A useful analysis considers the timing of the observation, the physical processes that influence the measurement, and the information available from complementary sources. This perspective separates an observed signal from a proposed explanation and from an action recommended to a user. Keeping those stages distinct makes it easier to investigate alternative causes, communicate ambiguity, and choose a proportionate next step.
This working guide considers radiometric calibration and reflectance consistency in cotton production fields. The immediate decision is to prioritise cotton field scouting. Useful reference evidence includes planting dates, growth stage and canopy observations. The case is an illustrative planning context, with assumptions to check against the actual sensor, landscape and project requirements.
Define the quantity that the instrument records
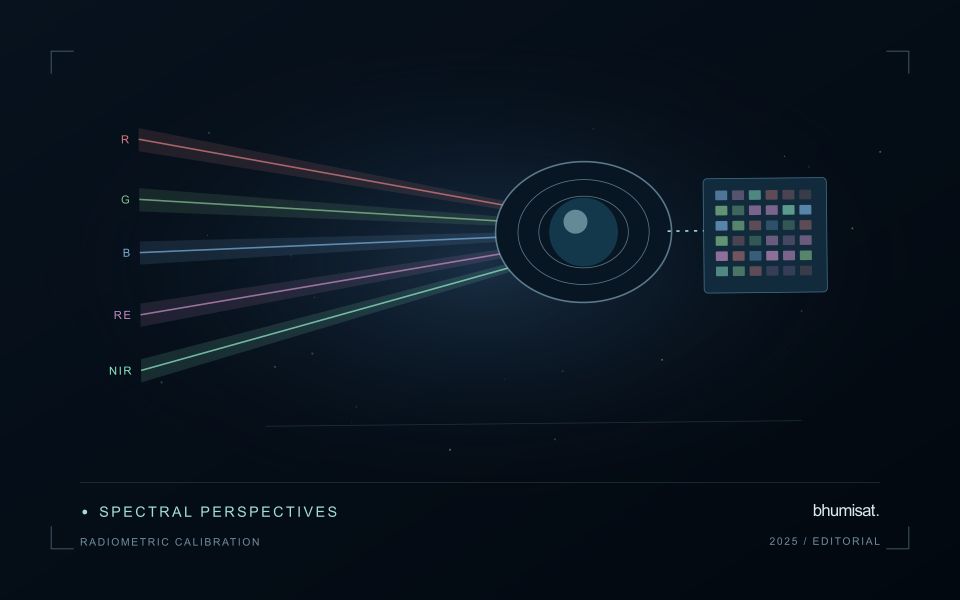
Radiometric calibration establishes a documented relationship between an instrument's recorded output and the physical quantity it is intended to represent. A stored pixel value may be a digital number, a scaled radiance or reflectance value, or another processed representation. Those alternatives should not be treated as interchangeable. The calibration chain explains how the recorded signal becomes an interpretable measurement and which corrections have already been applied. Understanding that chain is essential before comparing dates, combining bands or transferring a model between instruments.
Instrument response can vary across detectors, channels and operating conditions. Calibration therefore concerns more than selecting one conversion coefficient. A study may need to consider offsets, response differences, noise, saturation and changes in behaviour over time. The appropriate characterisation depends on the instrument and its intended use. For a future payload concept, these are requirements to investigate rather than capabilities established by an attractive render. The presence of a multispectral camera alone does not demonstrate that its channels produce consistent, quantitatively comparable observations.
Track consistency through the complete chain
At the product level, begin with the supplier's definitions and metadata. Check scale factors, additive offsets, fill values and valid ranges before deriving an index or statistical summary. Preserve the processing version so that an output can be reproduced later. Inspect whether extreme values correspond to real surfaces or to invalid observations. When a dataset is updated, compare representative old and new results rather than assuming that a familiar file name guarantees an unchanged numerical meaning throughout the archive.
Validation should cover the full chain that supports the stated application. A stable response in a laboratory test is valuable evidence, while operational imagery introduces additional effects from atmosphere, geometry and scene complexity. Use independent references suited to the measurement scale and report the relevant uncertainty. Maintain a record of corrections and their limitations when delivering results to users. A traceable radiometric workflow supports meaningful comparisons and helps separate a change in the observation system from a change in the landscape that a monitoring service is trying to describe.
The setting: Cotton production fields
Cotton fields can differ in planting time, variety, stand density and management, producing different image trajectories through the season. A monitoring programme should organise those differences before deciding which fields are unusual. Early observations often combine crop and soil, while later management and crop-stage changes can alter the canopy in ways that require contextual interpretation. A reliable field calendar is therefore as important as the choice of a vegetation measure.
Compare observations that meet consistent quality requirements and inspect whether a mapped pattern persists across suitable dates. Field boundaries, tracks, wet areas and neighbouring crops can affect irregular management units. Record the valid area contributing to a summary, especially when clouds or shadows leave only part of a field visible. If several image products are combined, evaluate their alignment and measurement consistency before treating a difference as evidence of crop change.
A scouting visit should collect observations that address the intended decision, such as uneven development or a need for agronomic review. Record crop stage, recent operations and the sampling area consistently. An optical anomaly is not a direct measurement of fibre characteristics or a confirmed diagnosis of a particular problem. Models for commercial outcomes require corresponding reference data and independent evaluation, while inspection products can be assessed through their usefulness in directing representative and timely field visits.
Design an evaluation that reflects deployment
A model evaluation should resemble the conditions in which the model will be used. Start by identifying which relationships the development data share: nearby locations, repeated observations of the same unit, common collection teams, or measurements from a single period. These relationships can make records less independent than they appear. An evaluation that ignores them may test the ability to recognise familiar conditions rather than the ability to operate in a new setting.
Choose a split strategy that matches the intended transfer. Holding out locations, seasons, operational units, or acquisition conditions can answer different questions. Document which question each split is designed to address, and keep the held-out evidence separate while selecting features and tuning the method. Repeatedly inspecting the same evaluation set to improve a model gradually makes that set part of development, even if it retains its original label.
Report results at a scale that is meaningful to the user. A strong average can hide poor performance for important subgroups or unusual conditions. Examine error patterns and retain examples of both successful and unsuccessful predictions. Where the evidence covers only a limited range of conditions, describe that range explicitly. The evaluation then becomes a practical guide to suitable use, further testing, and the collection of additional reference observations.
Locate the uncertainty that matters to the decision
An uncertainty budget is a practical description of where a result could become unreliable. Begin with the observation chain: acquisition, calibration, geographic matching, reference measurements, feature calculation, modelling, and delivery. Identify the assumptions at each stage and ask which could materially change the interpretation. The purpose is not to assign a precise number to every limitation. It is to locate the sources that deserve attention for the intended decision.
Separate limitations that can be measured from those that currently require a qualitative description. Repeated measurements may help characterise variability, while comparisons with independent references can reveal systematic differences. Some uncertainties interact, so combining individual error estimates without examining their relationships can produce a misleading impression of precision. Keep the method of assessment visible and avoid treating an unexamined assumption as though it were a negligible contribution.
Use the budget to prioritise further work. The largest visible source of variation is not always the one whose reduction would most improve the decision. Consider which additional observation, test, or contextual record would change confidence in an actionable way. Revisit the budget when the application, observation source, or deployment conditions change. This turns uncertainty analysis into a guide for improving the workflow rather than a qualification added only after the result has been delivered.
Bring the evidence back to the decision
A strong interpretation states what was observed, which explanations remain plausible, and what additional evidence would help distinguish them. Avoid presenting a convenient label as a confirmed cause when the measurements support only a broader pattern. Connect the proposed next step to the significance of the decision and the confidence available. This creates an interpretation that a field team, analyst, or project partner can examine, challenge, and improve as further observations become available.
Sources & further reading
Explore the bhumisat spacecraft concept and our vision towards 2030, or return to the journal.