A convincing image can still contain measurements that are unsuitable for a particular task. Quality control asks whether the inputs, transformations, and outputs meet the requirements of the intended application. This perspective follows evidence through the workflow, from acquisition metadata and reference observations to the final interpretation. It encourages teams to define acceptance conditions before seeing the result, rather than adjusting them to favour a preferred conclusion. The purpose is a repeatable way to distinguish usable observations, observations requiring qualification, and observations that should be excluded from a decision.
This working guide considers radiometric calibration and reflectance consistency along changing sandy shorelines. The immediate decision is to review shoreline positions over time. Useful reference evidence includes acquisition context, field positions and consistent shoreline definitions. The case is an illustrative planning context, with assumptions to check against the actual sensor, landscape and project requirements.
The setting: Changing sandy shorelines
A shoreline is not always one fixed boundary that every observation measures in the same way. The visible water edge, a vegetation boundary and another mapped coastal indicator can represent different features. A monitoring programme should define its chosen shoreline consistently before comparing dates. Tidal conditions, wave state, seasonal beach changes and the geometry of the image can all influence the position recorded, even without a lasting change in the coast.
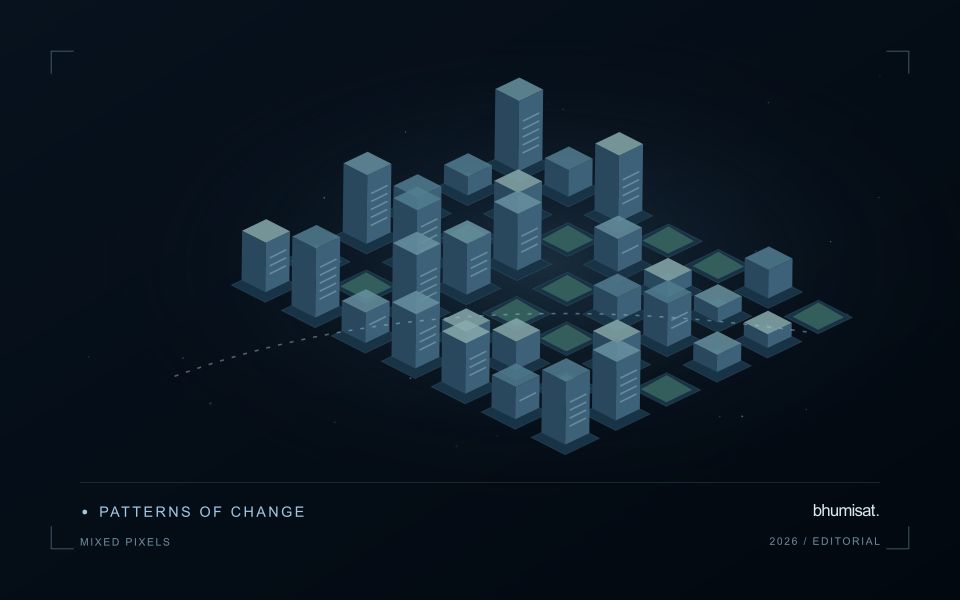
Spatial resolution and alignment determine the precision with which a boundary can be located. A sharply drawn line on a map should not imply more positional certainty than the observations support. Compare acquisitions under suitable conditions and retain the information needed to examine their differences. Mixed pixels, shadows and narrow coastal features may require manual review or an uncertainty zone rather than an automatic interpretation at every location.
Field validation should use the same shoreline definition as the image analysis and record when and how a position was measured. A visit under different water conditions may represent a different boundary even if its coordinates are accurate. Evaluate change over appropriate distances and periods, and avoid treating every small mapped displacement as erosion or deposition. A transparent product shows the observed positions, their dates and the uncertainty relevant to the decision being considered.
Define the quantity that the instrument records
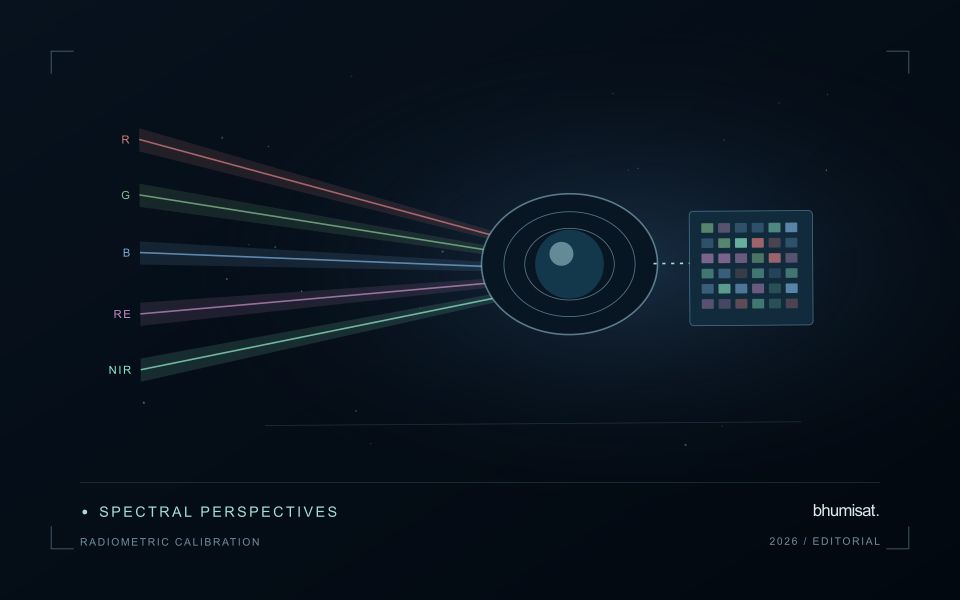
Radiometric calibration establishes a documented relationship between an instrument's recorded output and the physical quantity it is intended to represent. A stored pixel value may be a digital number, a scaled radiance or reflectance value, or another processed representation. Those alternatives should not be treated as interchangeable. The calibration chain explains how the recorded signal becomes an interpretable measurement and which corrections have already been applied. Understanding that chain is essential before comparing dates, combining bands or transferring a model between instruments.
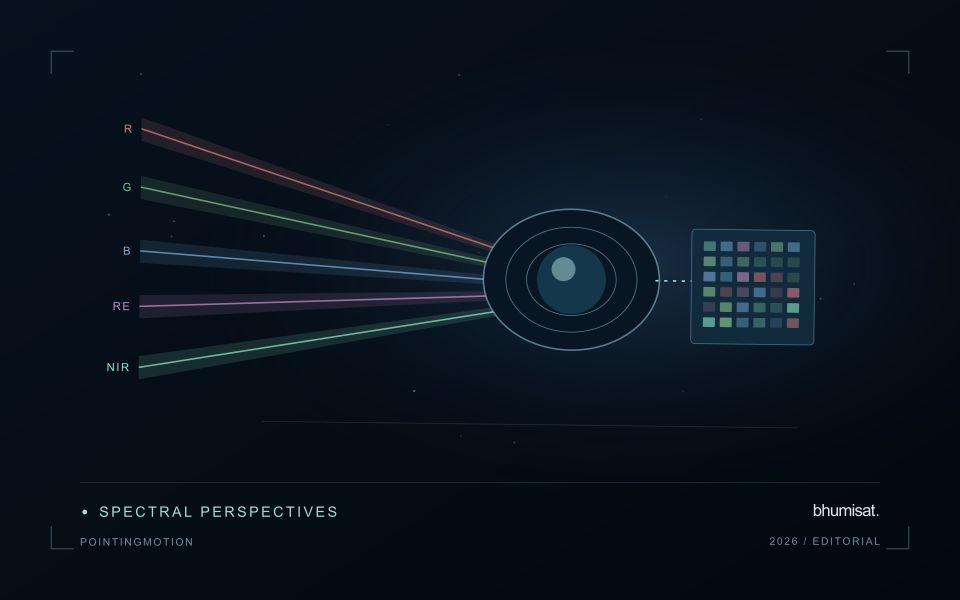
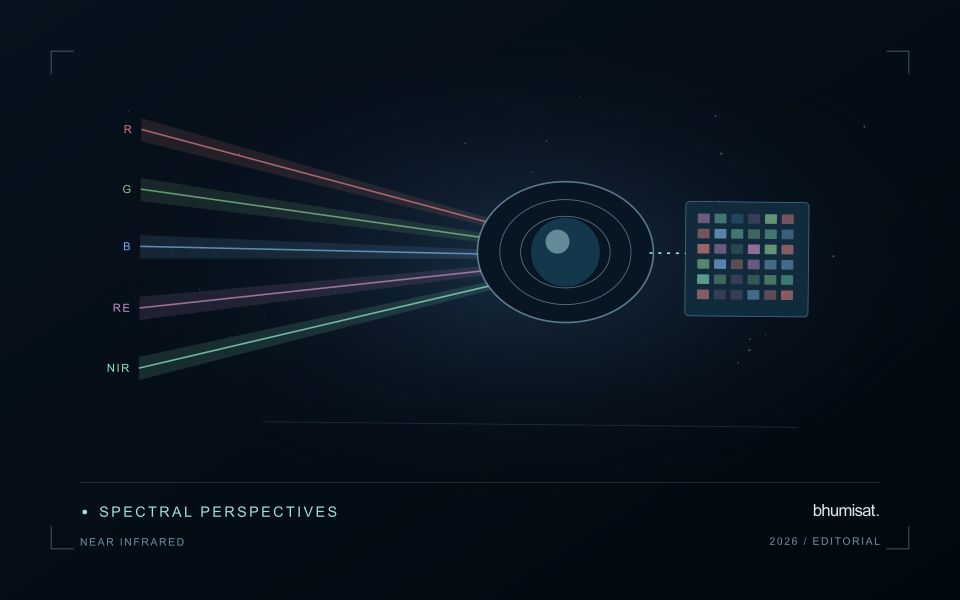
Instrument response can vary across detectors, channels and operating conditions. Calibration therefore concerns more than selecting one conversion coefficient. A study may need to consider offsets, response differences, noise, saturation and changes in behaviour over time. The appropriate characterisation depends on the instrument and its intended use. For a future payload concept, these are requirements to investigate rather than capabilities established by an attractive render. The presence of a multispectral camera alone does not demonstrate that its channels produce consistent, quantitatively comparable observations.
Track consistency through the complete chain
At the product level, begin with the supplier's definitions and metadata. Check scale factors, additive offsets, fill values and valid ranges before deriving an index or statistical summary. Preserve the processing version so that an output can be reproduced later. Inspect whether extreme values correspond to real surfaces or to invalid observations. When a dataset is updated, compare representative old and new results rather than assuming that a familiar file name guarantees an unchanged numerical meaning throughout the archive.
Validation should cover the full chain that supports the stated application. A stable response in a laboratory test is valuable evidence, while operational imagery introduces additional effects from atmosphere, geometry and scene complexity. Use independent references suited to the measurement scale and report the relevant uncertainty. Maintain a record of corrections and their limitations when delivering results to users. A traceable radiometric workflow supports meaningful comparisons and helps separate a change in the observation system from a change in the landscape that a monitoring service is trying to describe.
Design an evaluation that reflects deployment
A model evaluation should resemble the conditions in which the model will be used. Start by identifying which relationships the development data share: nearby locations, repeated observations of the same unit, common collection teams, or measurements from a single period. These relationships can make records less independent than they appear. An evaluation that ignores them may test the ability to recognise familiar conditions rather than the ability to operate in a new setting.
Choose a split strategy that matches the intended transfer. Holding out locations, seasons, operational units, or acquisition conditions can answer different questions. Document which question each split is designed to address, and keep the held-out evidence separate while selecting features and tuning the method. Repeatedly inspecting the same evaluation set to improve a model gradually makes that set part of development, even if it retains its original label.
Report results at a scale that is meaningful to the user. A strong average can hide poor performance for important subgroups or unusual conditions. Examine error patterns and retain examples of both successful and unsuccessful predictions. Where the evidence covers only a limited range of conditions, describe that range explicitly. The evaluation then becomes a practical guide to suitable use, further testing, and the collection of additional reference observations.
Connect observations within a catchment
Water-related observations often depend on processes beyond the immediate pixel or sampling location. Begin by identifying the geographic relationships that are relevant to the question: upstream areas, connected drainage paths, contributing land uses, and the receiving water body. A local pattern may be easier to interpret when placed within that wider setting. The catchment boundary is a useful organising unit, but its suitability should be checked against the process and observation scale.
Combine the remote observation with contextual records that can help explain its timing and spatial pattern. Rainfall, water level, land management, and known interventions can influence what is observed. Preserve the dates and geographic meaning of those records rather than treating them as timeless attributes. Where drainage connections are uncertain or change with conditions, state the limitation and consider whether additional mapping or reference observations would materially improve the interpretation.
Plan reference sampling across locations that distinguish plausible explanations. A set of measurements concentrated at an easily accessible outlet may provide a different view from one that also represents tributaries, source areas, and contrasting conditions. Document how each location contributes to the evaluation. Interpret spatial agreement with care, because connected observations can share influences and may not provide independent evidence. The resulting workflow should connect local measurements with a defensible account of the wider system they help describe.
Bring the evidence back to the decision
Quality control is most useful when its results travel with the information being delivered. Preserve the reasons for accepting or rejecting an observation, and expose limitations that could change the user's interpretation. Review recurring failures as clues about the design of the workflow. A clear quality record supports consistent comparisons between operators and processing versions, while helping the team decide whether a problem originates in acquisition, preparation, interpretation, or the underlying observation requirements.
Sources & further reading
Explore the bhumisat spacecraft concept and our vision towards 2030, or return to the journal.