Remote observations show patterns, while practical decisions depend on explaining what those patterns could mean. Interpretation therefore requires more than locating a high or low value on a map. A useful analysis considers the timing of the observation, the physical processes that influence the measurement, and the information available from complementary sources. This perspective separates an observed signal from a proposed explanation and from an action recommended to a user. Keeping those stages distinct makes it easier to investigate alternative causes, communicate ambiguity, and choose a proportionate next step.
This working guide considers how pointing and motion affect satellite imagery on mountain forest slopes. The immediate decision is to select terrain-aware forest inspection sites. Useful reference evidence includes slope setting, canopy observations and reliable sample locations. The case is an illustrative planning context, with assumptions to check against the actual sensor, landscape and project requirements.
Separate the different pointing requirements
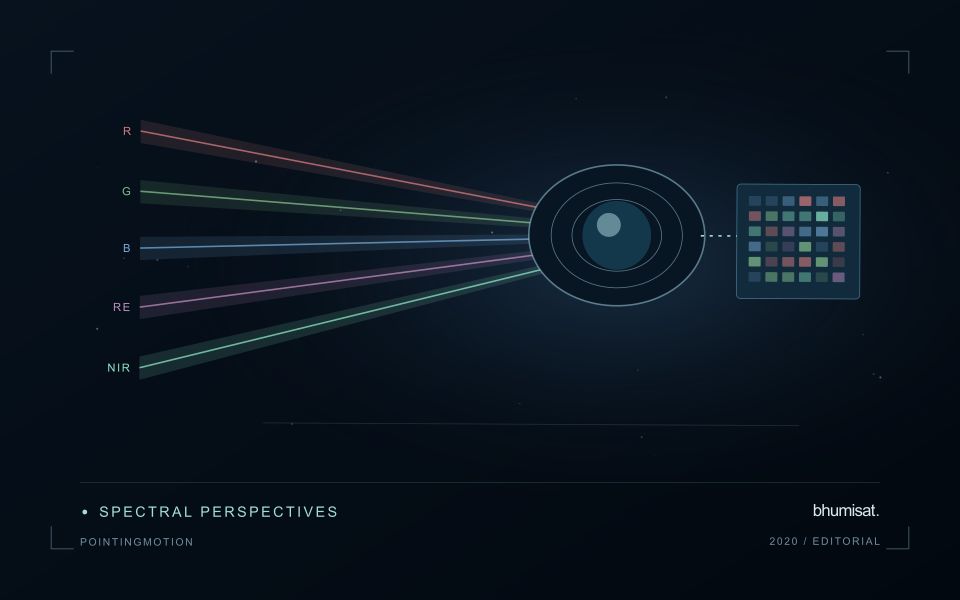
A camera can point near its intended target while still producing an image with poor geometry or blur. Pointing accuracy describes how closely the spacecraft achieves a commanded orientation. Pointing knowledge describes how well that orientation is estimated. Stability concerns changes over a relevant interval, including the detector integration period. These quantities serve different purposes and should be specified separately with a clear reference frame and time basis.
Orientation estimates combine information from sensors such as gyroscopes, Sun sensors and star trackers, depending on the architecture. Actuators then change or maintain the attitude. Reaction wheels exchange angular momentum with the spacecraft, while magnetic torquers interact with Earth's magnetic field and may support momentum management. Their suitability depends on the orbit, operating modes and disturbance environment. A component's advertised accuracy does not automatically become the pointing performance of the integrated spacecraft.
Evaluate the complete image motion budget
Ground features move across a detector because the spacecraft travels along its orbit and may rotate during imaging. Exposure time, scan timing and any motion compensation must be consistent with that movement. Residual motion during integration spreads signal across pixels and reduces contrast. High frequency vibration can produce a different image effect from slow drift, so one average attitude error may conceal an important problem.
Build an image motion budget that includes control behavior, structural response, actuator disturbances and timing uncertainties. Consider the mechanical path between attitude sensors and the optical payload: a flexible interface can change their relative alignment. Thermal distortion can also alter boresight alignment over an orbit. Test realistic operating combinations, including wheel speeds and other mechanisms that may run during an exposure, and assess whether laboratory support equipment affects the measurement.
Geometric processing uses orbit information, attitude knowledge, timing and an Earth model to locate observations. Ground control and image matching can improve some errors, but processing cannot always restore information lost to blur. For repeat observations, test relative registration as well as absolute location. Report residual errors across the field and across relevant operating conditions. A useful requirement links a user consequence, such as registration between spectral bands, to a measurable spacecraft or payload behavior and a verification method. This keeps pointing discussions connected to the quality of the delivered imagery.
The setting: Mountain forest slopes
A mountain forest combines canopy complexity with strong changes in slope, aspect and illumination. Locations that contain similar vegetation may appear different because they are observed under different lighting conditions. A monitoring design should therefore consider terrain alongside its ecological question. Define whether it concerns cover change, disturbance or a particular forest parameter, and establish comparison units that do not confuse a shadowed slope with a different type or condition of forest.
Image selection and processing should retain the information needed to examine these effects. Cloud, terrain shadow and changing viewing geometry can limit the usable record in different ways. A detailed elevation model may help describe the setting, but its resolution and alignment also need consideration. Review boundary areas and narrow valleys carefully, where mixed surfaces or small spatial offsets can have a large influence on an apparent change.
Field observations should represent the range of terrain settings in which the monitoring result will be used. Convenient valley access points may not characterise conditions on upper slopes. Record the location, slope context, canopy structure and date of each sample, along with uncertainty in locating it. A successful interpretation should remain defensible across the relevant terrain range. Where that has not been demonstrated, present the observation as a terrain-aware inspection lead rather than a fully validated forest measurement.
Maintain the geographic units of analysis
Many observation services summarise measurements within a field, management block, catchment, forest unit, or other mapped boundary. The meaning of that summary depends on whether the boundary accurately represents the unit being discussed. Start with a clear source for the geometry and record its date, coordinate reference, and intended use. A boundary drawn for visual orientation may require additional checking before it becomes a measurement unit.
Inspect overlaps, gaps, narrow fragments, and features that may have changed since mapping. A geometrically valid polygon can still describe an outdated operational unit. Ask the responsible team how divisions, mergers, new infrastructure, and management changes are recorded. Where pixels or reference measurements cross a boundary, define how they are assigned or excluded so that results remain comparable between analysts and processing runs.
Version the boundaries alongside the observations. If a unit changes, preserve a relationship between the previous and revised geometry rather than replacing the history without explanation. Comparisons through time should identify whether they use a constant spatial unit or the operational units valid at each date. This makes it easier to distinguish a change in the measured surface from a change introduced by the geography used to summarise it.
Locate the uncertainty that matters to the decision
An uncertainty budget is a practical description of where a result could become unreliable. Begin with the observation chain: acquisition, calibration, geographic matching, reference measurements, feature calculation, modelling, and delivery. Identify the assumptions at each stage and ask which could materially change the interpretation. The purpose is not to assign a precise number to every limitation. It is to locate the sources that deserve attention for the intended decision.
Separate limitations that can be measured from those that currently require a qualitative description. Repeated measurements may help characterise variability, while comparisons with independent references can reveal systematic differences. Some uncertainties interact, so combining individual error estimates without examining their relationships can produce a misleading impression of precision. Keep the method of assessment visible and avoid treating an unexamined assumption as though it were a negligible contribution.
Use the budget to prioritise further work. The largest visible source of variation is not always the one whose reduction would most improve the decision. Consider which additional observation, test, or contextual record would change confidence in an actionable way. Revisit the budget when the application, observation source, or deployment conditions change. This turns uncertainty analysis into a guide for improving the workflow rather than a qualification added only after the result has been delivered.
Bring the evidence back to the decision
A strong interpretation states what was observed, which explanations remain plausible, and what additional evidence would help distinguish them. Avoid presenting a convenient label as a confirmed cause when the measurements support only a broader pattern. Connect the proposed next step to the significance of the decision and the confidence available. This creates an interpretation that a field team, analyst, or project partner can examine, challenge, and improve as further observations become available.
Sources & further reading
Explore the bhumisat spacecraft concept and our vision towards 2030, or return to the journal.