Remote observations show patterns, while practical decisions depend on explaining what those patterns could mean. Interpretation therefore requires more than locating a high or low value on a map. A useful analysis considers the timing of the observation, the physical processes that influence the measurement, and the information available from complementary sources. This perspective separates an observed signal from a proposed explanation and from an action recommended to a user. Keeping those stages distinct makes it easier to investigate alternative causes, communicate ambiguity, and choose a proportionate next step.
This working guide considers how pointing and motion affect satellite imagery around energy infrastructure sites. The immediate decision is to review visible changes around infrastructure. Useful reference evidence includes site boundaries, operation context and dated field observations. The case is an illustrative planning context, with assumptions to check against the actual sensor, landscape and project requirements.
Separate the different pointing requirements
A camera can point near its intended target while still producing an image with poor geometry or blur. Pointing accuracy describes how closely the spacecraft achieves a commanded orientation. Pointing knowledge describes how well that orientation is estimated. Stability concerns changes over a relevant interval, including the detector integration period. These quantities serve different purposes and should be specified separately with a clear reference frame and time basis.
Orientation estimates combine information from sensors such as gyroscopes, Sun sensors and star trackers, depending on the architecture. Actuators then change or maintain the attitude. Reaction wheels exchange angular momentum with the spacecraft, while magnetic torquers interact with Earth's magnetic field and may support momentum management. Their suitability depends on the orbit, operating modes and disturbance environment. A component's advertised accuracy does not automatically become the pointing performance of the integrated spacecraft.
Evaluate the complete image motion budget
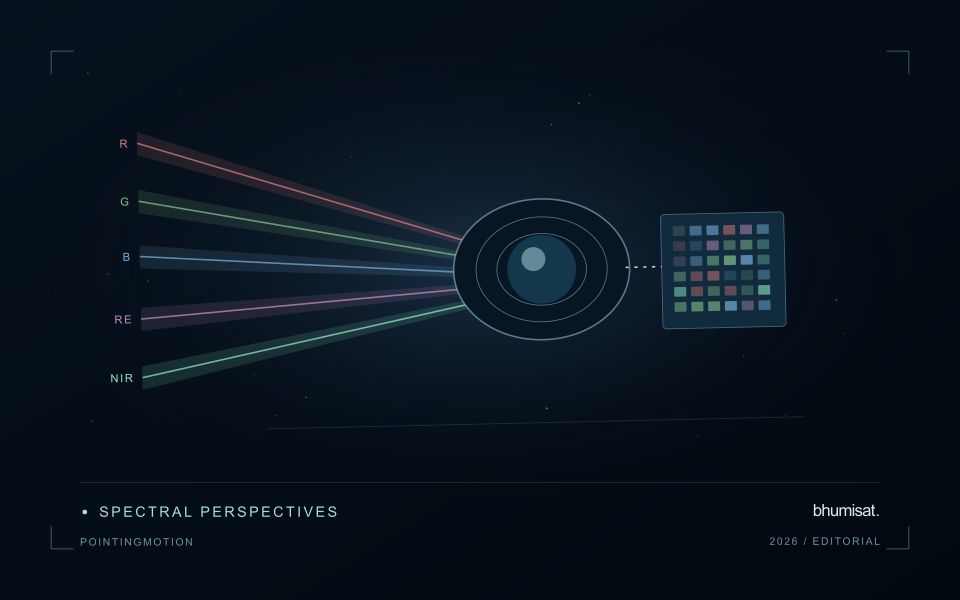
Ground features move across a detector because the spacecraft travels along its orbit and may rotate during imaging. Exposure time, scan timing and any motion compensation must be consistent with that movement. Residual motion during integration spreads signal across pixels and reduces contrast. High frequency vibration can produce a different image effect from slow drift, so one average attitude error may conceal an important problem.
Build an image motion budget that includes control behavior, structural response, actuator disturbances and timing uncertainties. Consider the mechanical path between attitude sensors and the optical payload: a flexible interface can change their relative alignment. Thermal distortion can also alter boresight alignment over an orbit. Test realistic operating combinations, including wheel speeds and other mechanisms that may run during an exposure, and assess whether laboratory support equipment affects the measurement.
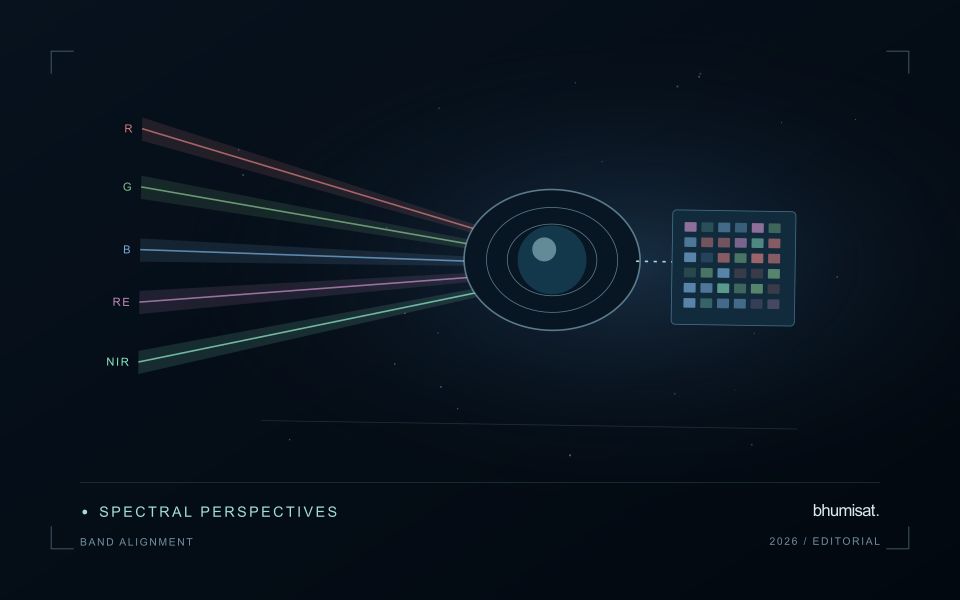
Geometric processing uses orbit information, attitude knowledge, timing and an Earth model to locate observations. Ground control and image matching can improve some errors, but processing cannot always restore information lost to blur. For repeat observations, test relative registration as well as absolute location. Report residual errors across the field and across relevant operating conditions. A useful requirement links a user consequence, such as registration between spectral bands, to a measurable spacecraft or payload behavior and a verification method. This keeps pointing discussions connected to the quality of the delivered imagery.
The setting: Energy infrastructure sites
An energy infrastructure site can combine buildings, equipment, access routes, vegetation, water and managed open land. A remote observation may be useful for reviewing visible changes around the site, but its interpretation depends on the feature and decision being studied. Mapping land-cover change, documenting surrounding vegetation and investigating a water pattern are separate objectives. Establish the site boundary and the relevant observation units before selecting analytical features or thresholds.
Large structures can introduce shadows and geometric effects, while narrow management zones may contain mixed observations. Review whether the image resolution supports the detail presented in the report. A change in nearby vegetation may follow normal maintenance, seasonal development or another land-use activity. Preserve the acquisition dates and any available operational context so that an observed pattern can be investigated without assigning an unsupported explanation to it.
Validation should describe the actual surface or feature observed and the spatial area represented by each record. Measurements inside the site and observations of its surroundings may answer different questions and should remain distinguishable. A satellite-derived alert can support a site review without establishing equipment performance or a particular operational condition. Evaluate whether the product provides relevant, interpretable evidence for the intended monitoring task, including instances where follow-up found that a visible change was expected or temporary.
Budget the complete processing workflow
A processing budget should cover the complete path from source observations to a maintained product. Data access and computing are only part of that path. Include preparation, geographic updates, reference collection, expert review, delivery, and support where those activities belong to the service. A calculation that runs cheaply on a small demonstration can still require substantial effort when the surrounding work is repeated across many locations.
Measure representative tasks rather than assuming that every observation costs the same amount to process. Record data volume, processing time, retry frequency, manual interventions, and the conditions that create unusually demanding cases. Separate fixed setup work from work that grows with the number of observations or users. These records support decisions about batching, caching, storage policy, and the point at which a different processing design becomes worthwhile.
Connect the budget to a defined level of service. Faster delivery, more frequent observation, broader coverage, or more detailed review can each change the resources required. Describe these trade-offs before promising a delivery pattern that the workflow has not demonstrated. Review the budget using operational evidence and preserve enough detail to understand changes between processing versions. The aim is a sustainable service whose resource choices remain aligned with the information that users value.
Locate the uncertainty that matters to the decision
An uncertainty budget is a practical description of where a result could become unreliable. Begin with the observation chain: acquisition, calibration, geographic matching, reference measurements, feature calculation, modelling, and delivery. Identify the assumptions at each stage and ask which could materially change the interpretation. The purpose is not to assign a precise number to every limitation. It is to locate the sources that deserve attention for the intended decision.
Separate limitations that can be measured from those that currently require a qualitative description. Repeated measurements may help characterise variability, while comparisons with independent references can reveal systematic differences. Some uncertainties interact, so combining individual error estimates without examining their relationships can produce a misleading impression of precision. Keep the method of assessment visible and avoid treating an unexamined assumption as though it were a negligible contribution.
Use the budget to prioritise further work. The largest visible source of variation is not always the one whose reduction would most improve the decision. Consider which additional observation, test, or contextual record would change confidence in an actionable way. Revisit the budget when the application, observation source, or deployment conditions change. This turns uncertainty analysis into a guide for improving the workflow rather than a qualification added only after the result has been delivered.
Bring the evidence back to the decision
A strong interpretation states what was observed, which explanations remain plausible, and what additional evidence would help distinguish them. Avoid presenting a convenient label as a confirmed cause when the measurements support only a broader pattern. Connect the proposed next step to the significance of the decision and the confidence available. This creates an interpretation that a field team, analyst, or project partner can examine, challenge, and improve as further observations become available.
Sources & further reading
Explore the bhumisat spacecraft concept and our vision towards 2030, or return to the journal.