Comparisons through time are valuable only when the observations are sufficiently comparable for the question being asked. A difference between dates can reflect real change, a normal stage in a seasonal cycle, or a difference in how the surface was observed. This perspective examines the reference period, the timing of acquisitions, and the contextual records needed to interpret a sequence. It encourages the use of appropriate baselines rather than treating every previous observation as an equivalent benchmark. The objective is to identify changes that remain meaningful after normal variation and measurement conditions are considered.
This working guide considers satellite time series and crop phenology across mixed smallholder farms. The immediate decision is to build a reliable farm-level inspection list. Useful reference evidence includes current crop inventory, plot boundaries and representative visits. The case is an illustrative planning context, with assumptions to check against the actual sensor, landscape and project requirements.
Describe a seasonal trajectory
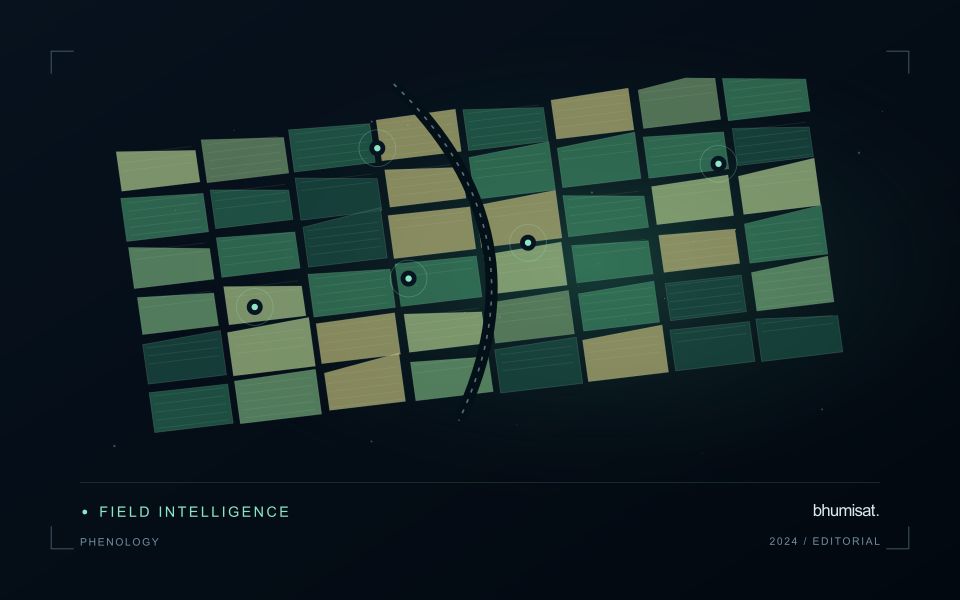
Phenology concerns the timing of recurring biological development. In an agricultural image series, a changing canopy can create a trajectory associated with establishment, growth, maturity and harvest. The trajectory is an indirect observation of those processes. Satellite measurements do not necessarily identify each agronomic stage on their own. A useful interpretation connects the series with crop type, planting information and field observations. This helps distinguish an unexpected development pattern from a normal difference in variety, management or seasonal timing.
The first design choice is the unit of comparison. A management block, planting cohort or crop zone may provide a more meaningful series than a broad administrative area containing several crops. Keep the spatial unit consistent and track changes to its boundary. Record which summary statistic is used and how many valid observations support it. A smooth line can be visually persuasive even when it connects only a few reliable dates. The chart should make gaps and uncertain periods visible instead of implying continuous knowledge.
Evaluate timing and missing observations
Timing metrics require explicit definitions. The date of a measured increase, the date inferred from a fitted curve and the date recorded by a field team may differ. Decide which quantity is needed and how it will be evaluated. Smoothing can reduce noise, but an overly flexible or overly rigid method can alter the apparent timing of an event. Compare candidate settings against independent observations and inspect whether they behave sensibly during short seasons, interrupted growth and abrupt management changes.
A practical monitoring service also needs a policy for delayed and missing data. Optical cloud cover can obscure a critical part of a season, and a later observation may only confirm that a transition occurred within an interval. Report that interval where appropriate. Do not replace an unavailable observation with an unlabelled estimate. Over several seasons, evaluate whether the derived timing information improves planning or interpretation and whether the relationship remains stable. The goal is a defensible seasonal description that supports a field decision, with its temporal uncertainty retained.
The setting: Mixed smallholder farms
A smallholder landscape can contain several crops, trees, buildings and paths within a compact area. Ownership boundaries may differ from the boundaries of the crop actually observed, and planting dates can vary between nearby plots. The first useful product is often a reliable inventory of what is being monitored. Record the crop, the planted area and the management question before deciding whether a satellite summary can represent that unit adequately.
Mixed pixels and boundary uncertainty deserve explicit attention. A value displayed over a small plot may include substantial contributions from neighbouring vegetation or other surfaces. Higher visual detail in the map does not remove this limitation. Use observation products appropriate for the plot size, review alignment carefully and retain information about valid coverage. Where satellite data do not resolve the required unit, complementary field observations may be more useful than a finer-looking interpretation.
A practical field programme should sample the diversity of crops, plot sizes and management conditions in the service area. Record location, date, crop stage and the circumstances that explain a mapped pattern. A model developed for one crop or estate should not be assumed to transfer directly to these mixed settings. Evaluate the specific farm-level decision, such as planning visits or updating an inventory, and communicate which conclusions are supported at plot scale and which remain broader landscape observations.
Represent gaps without inventing observations
A monitoring sequence often contains periods without a usable observation. The reason may be cloud, shadow, missing coverage, a failed transfer, or a quality condition that excludes the data. Begin by representing these states explicitly. A missing observation is different from a low measurement, an unchanged surface, or a confirmed absence of the feature being studied. The distinction should survive both the analysis and the presentation of the result.
Define when a temporal gap is acceptable for the intended decision. A workflow may continue using the latest qualified observation, request another source, or suspend an alert until sufficient evidence is available. Whichever response is selected, show the age of the supporting observation. If interpolation is used for a suitable analytical purpose, preserve the distinction between an estimated value and a directly observed measurement, together with the assumptions needed to interpret it.
Review how gaps affect the coverage of the final evaluation. Locations with frequent missing data may differ systematically from those with regular observations. A performance estimate based only on clear, complete records can therefore describe a narrower population than the service is expected to support. Report usable coverage alongside analytical results and use recurring gaps to guide acquisition planning, reference collection, and the selection of complementary observation methods.
Maintain the geographic units of analysis
Many observation services summarise measurements within a field, management block, catchment, forest unit, or other mapped boundary. The meaning of that summary depends on whether the boundary accurately represents the unit being discussed. Start with a clear source for the geometry and record its date, coordinate reference, and intended use. A boundary drawn for visual orientation may require additional checking before it becomes a measurement unit.
Inspect overlaps, gaps, narrow fragments, and features that may have changed since mapping. A geometrically valid polygon can still describe an outdated operational unit. Ask the responsible team how divisions, mergers, new infrastructure, and management changes are recorded. Where pixels or reference measurements cross a boundary, define how they are assigned or excluded so that results remain comparable between analysts and processing runs.
Version the boundaries alongside the observations. If a unit changes, preserve a relationship between the previous and revised geometry rather than replacing the history without explanation. Comparisons through time should identify whether they use a constant spatial unit or the operational units valid at each date. This makes it easier to distinguish a change in the measured surface from a change introduced by the geography used to summarise it.
Bring the evidence back to the decision
A useful comparison preserves the dates, quality conditions, and contextual assumptions behind its baseline. Review unusual results against the actual observation sequence rather than relying entirely on a summary statistic. Where seasonal timing is important, describe how comparable stages were identified. The resulting analysis should help users distinguish an informative change from an expected cycle or an observation artefact, while making gaps and remaining uncertainty visible enough to guide further investigation.
Sources & further reading
Explore the bhumisat spacecraft concept and our vision towards 2030, or return to the journal.