Every observation and interpretation contains uncertainty, but the sources and consequences of that uncertainty differ between applications. Some arise from acquisition conditions, others from reference measurements, processing choices, or the transfer of a model to a new setting. This perspective examines how those sources affect the decision a user is considering. It encourages teams to describe uncertainty in a form that can influence action, rather than adding a generic qualification at the end of a report. The objective is to support proportionate decisions while keeping the limits of the available evidence understandable.
This working guide considers satellite time series and crop phenology in cotton production fields. The immediate decision is to prioritise cotton field scouting. Useful reference evidence includes planting dates, growth stage and canopy observations. The case is an illustrative planning context, with assumptions to check against the actual sensor, landscape and project requirements.
The setting: Cotton production fields
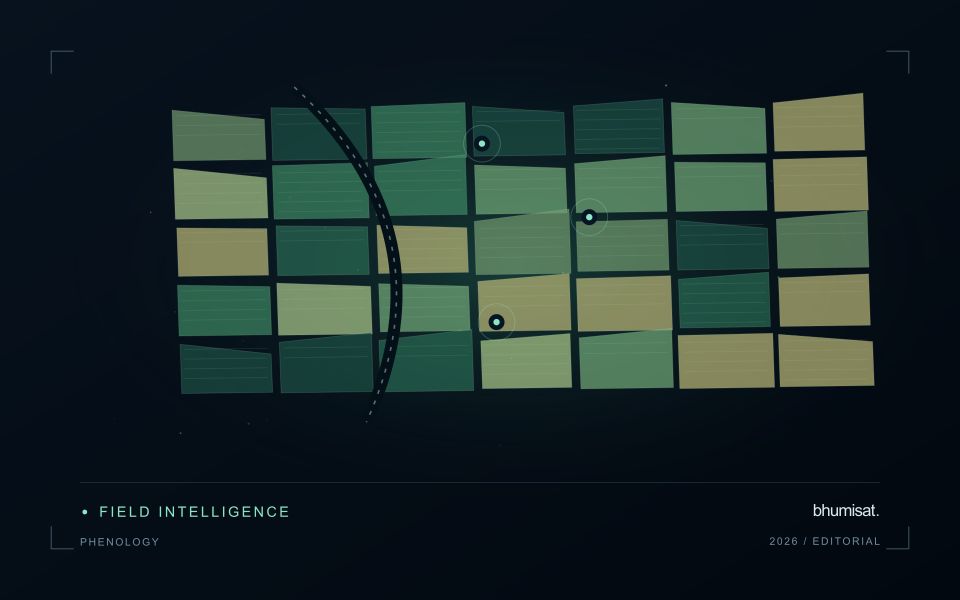
Cotton fields can differ in planting time, variety, stand density and management, producing different image trajectories through the season. A monitoring programme should organise those differences before deciding which fields are unusual. Early observations often combine crop and soil, while later management and crop-stage changes can alter the canopy in ways that require contextual interpretation. A reliable field calendar is therefore as important as the choice of a vegetation measure.
Compare observations that meet consistent quality requirements and inspect whether a mapped pattern persists across suitable dates. Field boundaries, tracks, wet areas and neighbouring crops can affect irregular management units. Record the valid area contributing to a summary, especially when clouds or shadows leave only part of a field visible. If several image products are combined, evaluate their alignment and measurement consistency before treating a difference as evidence of crop change.
A scouting visit should collect observations that address the intended decision, such as uneven development or a need for agronomic review. Record crop stage, recent operations and the sampling area consistently. An optical anomaly is not a direct measurement of fibre characteristics or a confirmed diagnosis of a particular problem. Models for commercial outcomes require corresponding reference data and independent evaluation, while inspection products can be assessed through their usefulness in directing representative and timely field visits.
Describe a seasonal trajectory
Phenology concerns the timing of recurring biological development. In an agricultural image series, a changing canopy can create a trajectory associated with establishment, growth, maturity and harvest. The trajectory is an indirect observation of those processes. Satellite measurements do not necessarily identify each agronomic stage on their own. A useful interpretation connects the series with crop type, planting information and field observations. This helps distinguish an unexpected development pattern from a normal difference in variety, management or seasonal timing.
The first design choice is the unit of comparison. A management block, planting cohort or crop zone may provide a more meaningful series than a broad administrative area containing several crops. Keep the spatial unit consistent and track changes to its boundary. Record which summary statistic is used and how many valid observations support it. A smooth line can be visually persuasive even when it connects only a few reliable dates. The chart should make gaps and uncertain periods visible instead of implying continuous knowledge.
Evaluate timing and missing observations
Timing metrics require explicit definitions. The date of a measured increase, the date inferred from a fitted curve and the date recorded by a field team may differ. Decide which quantity is needed and how it will be evaluated. Smoothing can reduce noise, but an overly flexible or overly rigid method can alter the apparent timing of an event. Compare candidate settings against independent observations and inspect whether they behave sensibly during short seasons, interrupted growth and abrupt management changes.
A practical monitoring service also needs a policy for delayed and missing data. Optical cloud cover can obscure a critical part of a season, and a later observation may only confirm that a transition occurred within an interval. Report that interval where appropriate. Do not replace an unavailable observation with an unlabelled estimate. Over several seasons, evaluate whether the derived timing information improves planning or interpretation and whether the relationship remains stable. The goal is a defensible seasonal description that supports a field decision, with its temporal uncertainty retained.
Use observation labels with consistent meanings
A reference label should describe an observation that another person could recognise or reproduce. Broad terms such as good, damaged, or unusual can conceal substantial differences between collection teams. Begin by defining the feature or condition being recorded, the observation unit, and the evidence needed to assign a label. Where possible, distinguish a direct measurement from an interpretation made by the observer.
Provide a short collection guide with examples, boundary cases, and a way to record uncertainty. Train observers using shared cases before relying on independently collected labels. If two observers disagree, preserve the disagreement long enough to understand its cause. It may reveal an unclear definition, a genuinely ambiguous condition, a difference in observation scale, or a problem in matching the reference record to the remote measurement.
Retain the context that makes the label interpretable. Location, time, collection method, observer role, and relevant surface conditions can be essential for later review. Changes to the label scheme should be documented and related to earlier versions where a defensible correspondence exists. Consistent labels do not eliminate uncertainty, but they make it possible to investigate disagreement, evaluate analytical methods, and identify where better definitions or additional measurements would improve the evidence.
Design field observations around the information need
Field observations are most useful when they answer a defined question within the monitoring workflow. Begin by identifying the variable, condition, or management event that needs to be recorded and the geographic unit to which it applies. Distinguish direct measurements from an observer's interpretation. A consistent record of crop stage, management timing, and visible conditions can provide valuable context even when the field team is not collecting a complex set of measurements.
Prepare a collection protocol that reflects the variability of the site. Define where observations are made within a unit, how many locations are represented, and how the position and time are recorded. Avoid selecting only the most dramatic or convenient examples. Include apparently normal conditions and records that might challenge the remote interpretation. Where a measurement method has known limitations, preserve the information needed to assess whether those limitations affect the intended comparison.
Link field records to the corresponding remote observations without losing their original detail. Geographic matching, timing, and the scale represented by each record should remain visible. Review disagreements with the collecting team before changing a label or excluding an observation. A disagreement may reveal a timing mismatch, a mixed surface, or an incomplete interpretation rather than a simple error. The field programme should improve the understanding of the monitoring process as well as provide evidence for evaluating its outputs.
Bring the evidence back to the decision
Useful uncertainty communication identifies the limitation, explains how it could affect the result, and connects it to a practical response. Some decisions can proceed with a qualified estimate; others require another observation or an independent check. Preserve uncertainty information through processing and delivery so that it is available at the point of use. This makes the analysis more accountable and gives the team a clearer basis for deciding which additional evidence would most improve the outcome.
Sources & further reading
Explore the bhumisat spacecraft concept and our vision towards 2030, or return to the journal.