Comparisons through time are valuable only when the observations are sufficiently comparable for the question being asked. A difference between dates can reflect real change, a normal stage in a seasonal cycle, or a difference in how the surface was observed. This perspective examines the reference period, the timing of acquisitions, and the contextual records needed to interpret a sequence. It encourages the use of appropriate baselines rather than treating every previous observation as an equivalent benchmark. The objective is to identify changes that remain meaningful after normal variation and measurement conditions are considered.
This working guide considers near-infrared observations of vegetation and land in vineyard production parcels. The immediate decision is to prioritise vineyard zone inspections. Useful reference evidence includes vine growth stage, row management and sampling locations. The case is an illustrative planning context, with assumptions to check against the actual sensor, landscape and project requirements.
The setting: Vineyard production parcels
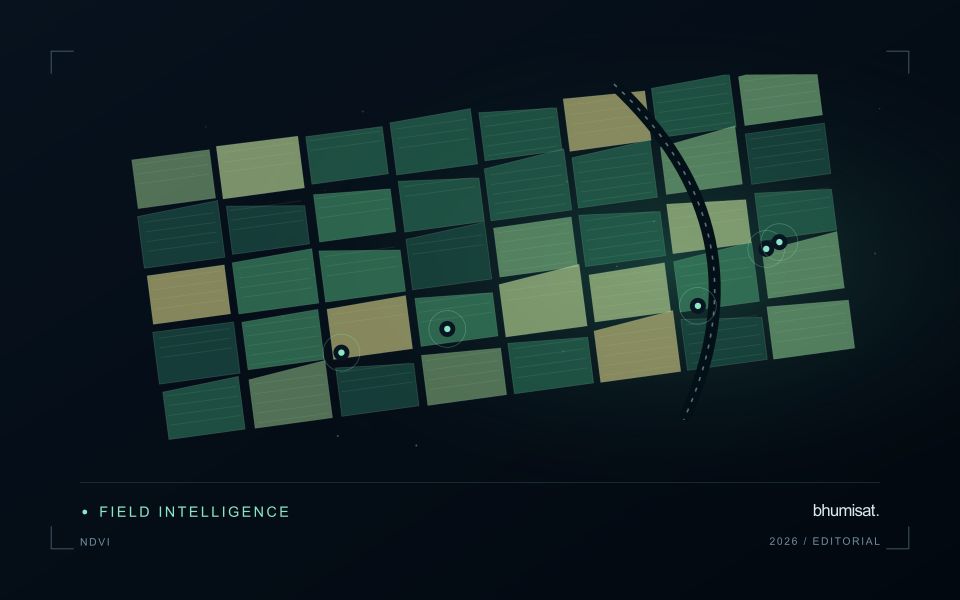
Vineyard imagery combines vine rows with inter-row vegetation, exposed soil, tracks and sometimes steep terrain. Row direction, canopy training and management can substantially influence the observed pattern. The relevant unit may be a parcel, a management zone or a sampled part of a row, and these units should be defined before analysis begins. A map with many small coloured areas does not necessarily provide measurements at the scale of an individual vine.
Build comparisons around growth stage and known operations such as canopy management or changes in inter-row cover. Inspect terrain-related illumination and geometric alignment where slopes or narrow parcels make these effects important. Record the proportion of valid observations used to describe each zone. When integrating drone and satellite imagery, consider their different acquisition times and spatial support rather than assuming that agreement should occur at every displayed pixel.
Field sampling should represent the range of mapped zones and include locations that appear ordinary. Record vine stage, management context and the precise area represented by each measurement. Relationships with fruit characteristics or production need reference observations that address those outcomes directly. A useful operational product can begin as a consistent zoning and inspection workflow, with stronger agronomic interpretations introduced only after the relationship between the image pattern and the field evidence has been evaluated.
Understand what contributes to the NIR response
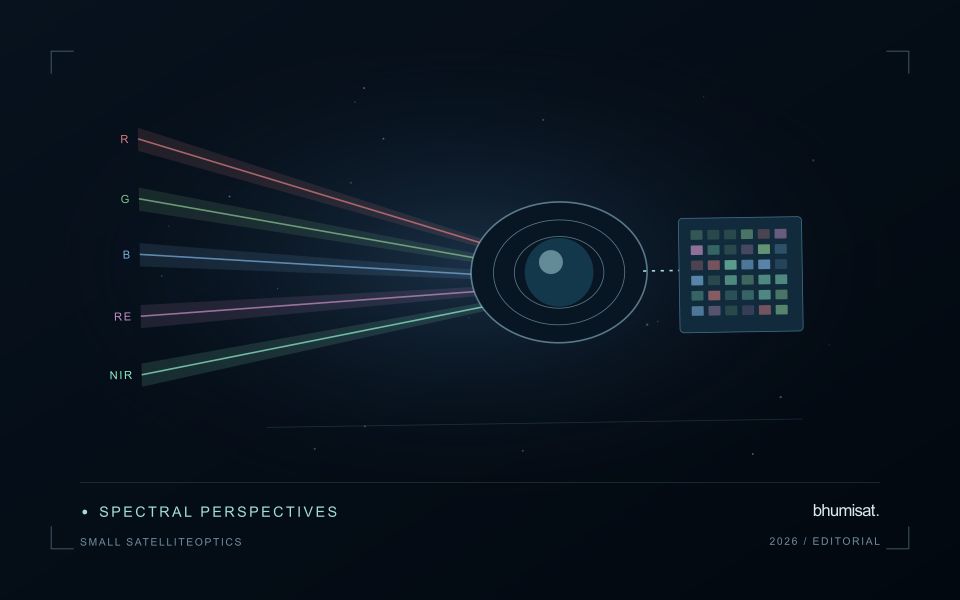
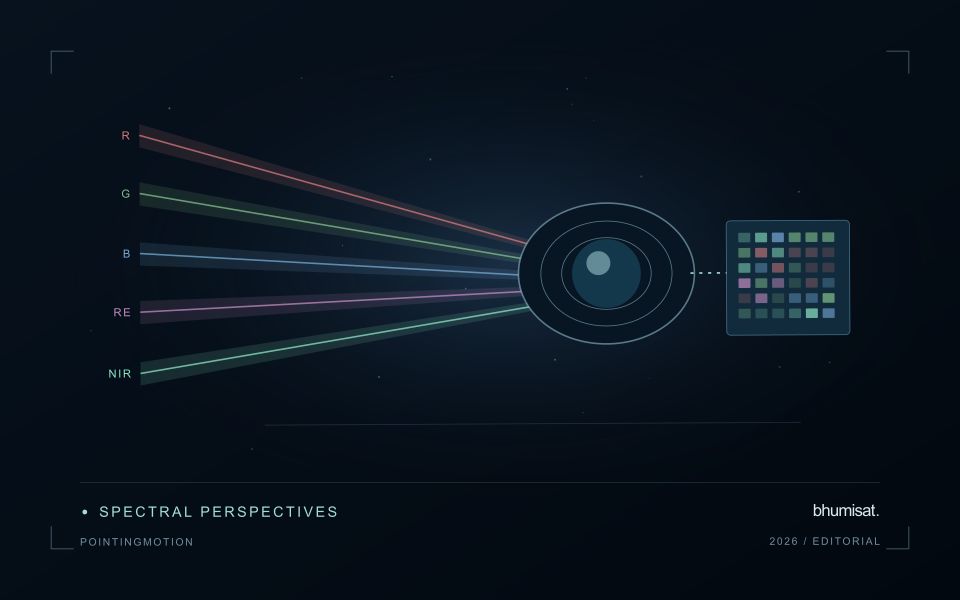
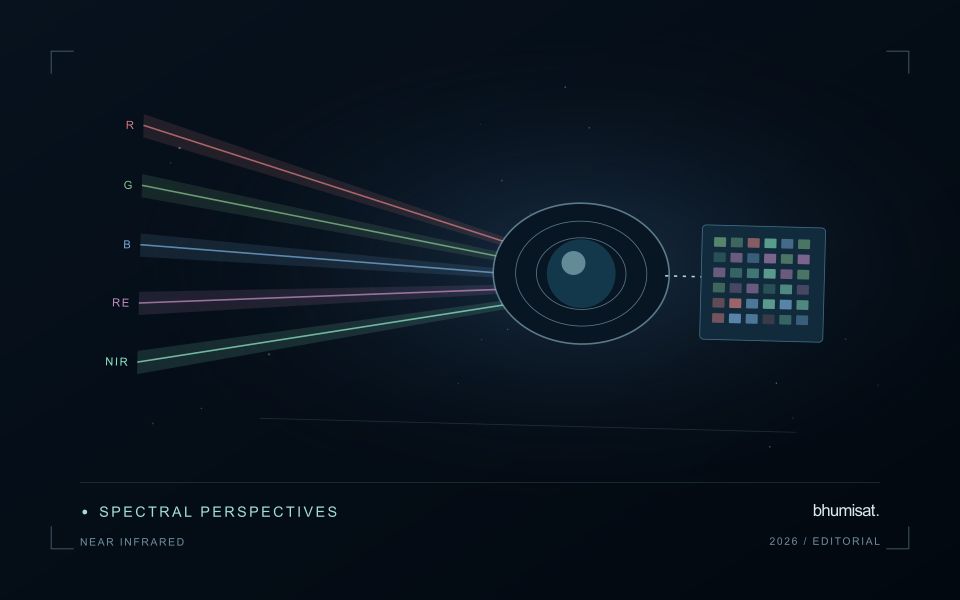
Near-infrared wavelengths lie outside the range of human vision, but they are important in optical observations of vegetation and land. A near-infrared image should not be confused with a thermal image. Reflected sunlight in this region and emitted thermal radiation describe different physical processes. This distinction matters when communicating crop information: a bright or dark NIR response is not a direct temperature reading. Its interpretation depends on the surface, the observation geometry and the particular wavelength interval measured by the instrument.
Vegetation can show a strong near-infrared response because of interactions within leaves and canopies. At landscape scale, the observed signal also changes with canopy cover, leaf arrangement, shadows and the proportion of visible soil or water. A field with a different crop age may therefore differ substantially from another field without either being abnormal. NIR is useful partly because it adds contrast beyond visible appearance, but that contrast still needs a meaningful comparison. The analytical task determines which associated measurements and field records are required.
Use NIR in a traceable analytical chain
When combining NIR with another band in an index or model, check that the channels refer to comparable ground locations and acquisition conditions. Differences in band resolution, alignment or spectral response can influence the result. Preserve reflectance scale factors, quality flags and any processing applied before the combination. Where resampling is necessary, choose a documented common grid and recognise that the operation changes representation rather than increasing the original observation detail. These controls are particularly important near field edges and in small management units.
An application should demonstrate the benefit of the NIR measurement using evidence appropriate to its stated purpose. For vegetation monitoring, that might mean a relationship with independently recorded canopy conditions or a reliable separation of relevant land-cover classes. For water or soil interpretation, a different protocol may be needed. Review errors as well as successful examples and retain cases that challenge the initial explanation. A clear observation chain makes NIR a useful part of a broader decision process without assigning the band capabilities it does not independently provide.
Locate the uncertainty that matters to the decision
An uncertainty budget is a practical description of where a result could become unreliable. Begin with the observation chain: acquisition, calibration, geographic matching, reference measurements, feature calculation, modelling, and delivery. Identify the assumptions at each stage and ask which could materially change the interpretation. The purpose is not to assign a precise number to every limitation. It is to locate the sources that deserve attention for the intended decision.
Separate limitations that can be measured from those that currently require a qualitative description. Repeated measurements may help characterise variability, while comparisons with independent references can reveal systematic differences. Some uncertainties interact, so combining individual error estimates without examining their relationships can produce a misleading impression of precision. Keep the method of assessment visible and avoid treating an unexamined assumption as though it were a negligible contribution.
Use the budget to prioritise further work. The largest visible source of variation is not always the one whose reduction would most improve the decision. Consider which additional observation, test, or contextual record would change confidence in an actionable way. Revisit the budget when the application, observation source, or deployment conditions change. This turns uncertainty analysis into a guide for improving the workflow rather than a qualification added only after the result has been delivered.
Keep an auditable review record
A review record should explain how a result moved from an analytical output to an accepted interpretation or operational decision. Preserve the product identifier, the evidence considered, the reviewer role, and the outcome of the review. A short, consistent record is often more useful than an extensive free-text note that cannot be compared between cases. The objective is to make important decisions traceable without turning routine review into unnecessary administrative work.
Separate observations from conclusions within the record. Describe the evidence visible to the reviewer, the alternative explanations considered where relevant, and the reason for accepting, qualifying, or rejecting the result. If a correction is required, identify what should change and how the revised product relates to the earlier version. Keep unresolved questions visible so that they can be addressed by another observation or by the person responsible for the next action.
Use the accumulated record to improve the workflow. Recurring review reasons can reveal unclear requirements, missing contextual information, unstable processing steps, or an evaluation gap. Examine whether similar cases receive similar decisions across reviewers and over time. Preserve the relationship between feedback and subsequent revisions so that improvements can be assessed against the evidence that motivated them. An auditable record supports learning, accountability, and consistent delivery while allowing the technical process to evolve.
Bring the evidence back to the decision
A useful comparison preserves the dates, quality conditions, and contextual assumptions behind its baseline. Review unusual results against the actual observation sequence rather than relying entirely on a summary statistic. Where seasonal timing is important, describe how comparable stages were identified. The resulting analysis should help users distinguish an informative change from an expected cycle or an observation artefact, while making gaps and remaining uncertainty visible enough to guide further investigation.
Sources & further reading
Explore the bhumisat spacecraft concept and our vision towards 2030, or return to the journal.