Every observation and interpretation contains uncertainty, but the sources and consequences of that uncertainty differ between applications. Some arise from acquisition conditions, others from reference measurements, processing choices, or the transfer of a model to a new setting. This perspective examines how those sources affect the decision a user is considering. It encourages teams to describe uncertainty in a form that can influence action, rather than adding a generic qualification at the end of a report. The objective is to support proportionate decisions while keeping the limits of the available evidence understandable.
This working guide considers near-infrared observations of vegetation and land within urban green-space mosaics. The immediate decision is to select green-space locations for assessment. Useful reference evidence includes canopy cover, surface context and appropriately timed measurements. The case is an illustrative planning context, with assumptions to check against the actual sensor, landscape and project requirements.
The setting: Urban green-space mosaics
Urban green spaces form mosaics of trees, grass, bare ground, paths, buildings and water. The observation needed depends on whether the project concerns vegetation cover, land-surface temperature or a particular use of the space. These are distinct variables. Visible and near-infrared imagery can describe vegetation-related patterns, while a temperature study requires suitable thermal measurements and an interpretation that respects what those measurements represent rather than treating greenness as a temperature sensor.
Define park or management boundaries and inspect how surrounding urban surfaces contribute to each observation. Shade, seasonal foliage and maintenance can affect vegetation comparisons, while acquisition timing matters strongly to a thermal interpretation. Data from different instruments may also have different spatial support. A fine-looking display should not suggest that a coarse thermal measurement resolves the same detail as an optical image or an individual tree inventory.
Field validation should record the target variable with methods and timing suited to the intended claim. Canopy observations, surface measurements and information about how people use a site provide different evidence streams. A remotely observed pattern may help choose assessment locations without establishing a complete account of human exposure or park performance. Evaluate the specific management decision, and communicate the scale, observation time and uncertainty that determine how the resulting map can be used.
Understand what contributes to the NIR response
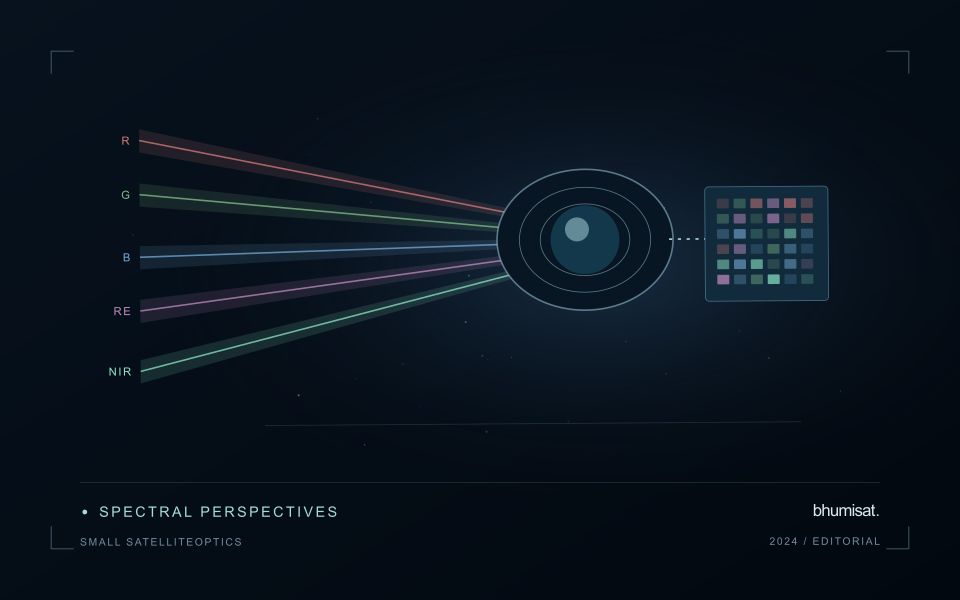
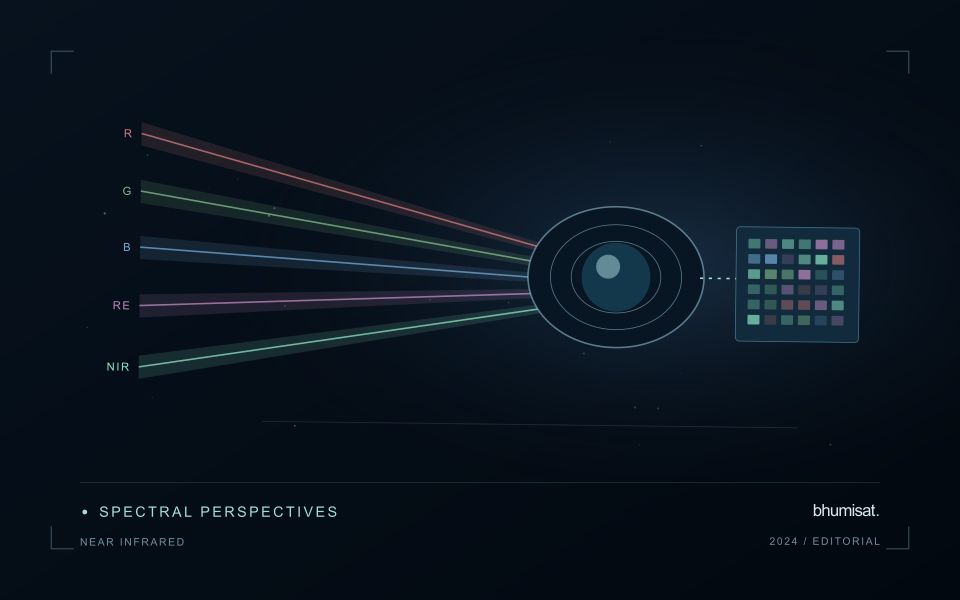
Near-infrared wavelengths lie outside the range of human vision, but they are important in optical observations of vegetation and land. A near-infrared image should not be confused with a thermal image. Reflected sunlight in this region and emitted thermal radiation describe different physical processes. This distinction matters when communicating crop information: a bright or dark NIR response is not a direct temperature reading. Its interpretation depends on the surface, the observation geometry and the particular wavelength interval measured by the instrument.
Vegetation can show a strong near-infrared response because of interactions within leaves and canopies. At landscape scale, the observed signal also changes with canopy cover, leaf arrangement, shadows and the proportion of visible soil or water. A field with a different crop age may therefore differ substantially from another field without either being abnormal. NIR is useful partly because it adds contrast beyond visible appearance, but that contrast still needs a meaningful comparison. The analytical task determines which associated measurements and field records are required.
Use NIR in a traceable analytical chain
When combining NIR with another band in an index or model, check that the channels refer to comparable ground locations and acquisition conditions. Differences in band resolution, alignment or spectral response can influence the result. Preserve reflectance scale factors, quality flags and any processing applied before the combination. Where resampling is necessary, choose a documented common grid and recognise that the operation changes representation rather than increasing the original observation detail. These controls are particularly important near field edges and in small management units.
An application should demonstrate the benefit of the NIR measurement using evidence appropriate to its stated purpose. For vegetation monitoring, that might mean a relationship with independently recorded canopy conditions or a reliable separation of relevant land-cover classes. For water or soil interpretation, a different protocol may be needed. Review errors as well as successful examples and retain cases that challenge the initial explanation. A clear observation chain makes NIR a useful part of a broader decision process without assigning the band capabilities it does not independently provide.
Check spatial alignment before comparison
A comparison between images, channels, maps, or field measurements assumes that the observations refer to the same locations at a suitable level of precision. Small alignment errors can become especially important near boundaries or narrow features. Before interpreting differences, inspect whether identifiable, stable features agree between the sources. A common coordinate reference is necessary for many workflows, but it does not by itself demonstrate accurate alignment.
Use control features that are appropriate for the observation scale and remain stable across the comparison period. Evaluate alignment in more than one part of the area, because a single location cannot reveal spatially varying distortion. Record the method used to estimate any correction and retain independent features for checking the corrected result. Where surfaces have genuinely changed, avoid using those changes as evidence of an alignment error.
Propagate the implications of remaining misalignment into the analysis. A workflow may exclude boundary pixels, summarise at a broader scale, or qualify interpretations for small features. The choice should follow the application rather than a preference for visually smooth output. Preserve both the original and corrected geographic references, and document resampling decisions so that future users can understand how measurements were moved onto a common spatial framework.
Validate land-cover transitions
A mapped change should describe a transition between meaningful surface states, not merely a difference between two classifications. Begin by defining the land-cover categories, the geographic unit, and the kinds of transition relevant to the application. Categories should be interpretable in the observations available at each date. A distinction that cannot be recognised consistently can create apparent change even when the underlying surface remains similar.
Evaluate the observations supporting both sides of the transition. Differences in acquisition conditions, geographic alignment, seasonal vegetation, shadows, or class definitions can influence the result. Review stable locations alongside apparent changes, and retain the source imagery or other evidence needed to investigate ambiguous cases. Where multiple changes occur within a geographic unit, describe how the workflow represents mixtures rather than forcing a single label that conceals important variation.
Use reference evidence that reflects the timing and scale of the claimed transition. A recent inspection may confirm the current surface without establishing when a previous condition changed. Historical imagery, dated records, and complementary observations can strengthen that sequence where available. Report uncertainty in the transition itself, including ambiguous starting or ending states. This produces a change product that users can examine as a documented account of land-cover evolution rather than an unexplained set of coloured differences.
Bring the evidence back to the decision
Useful uncertainty communication identifies the limitation, explains how it could affect the result, and connects it to a practical response. Some decisions can proceed with a qualified estimate; others require another observation or an independent check. Preserve uncertainty information through processing and delivery so that it is available at the point of use. This makes the analysis more accountable and gives the team a clearer basis for deciding which additional evidence would most improve the outcome.
Sources & further reading
Explore the bhumisat spacecraft concept and our vision towards 2030, or return to the journal.