Remote observations show patterns, while practical decisions depend on explaining what those patterns could mean. Interpretation therefore requires more than locating a high or low value on a map. A useful analysis considers the timing of the observation, the physical processes that influence the measurement, and the information available from complementary sources. This perspective separates an observed signal from a proposed explanation and from an action recommended to a user. Keeping those stages distinct makes it easier to investigate alternative causes, communicate ambiguity, and choose a proportionate next step.
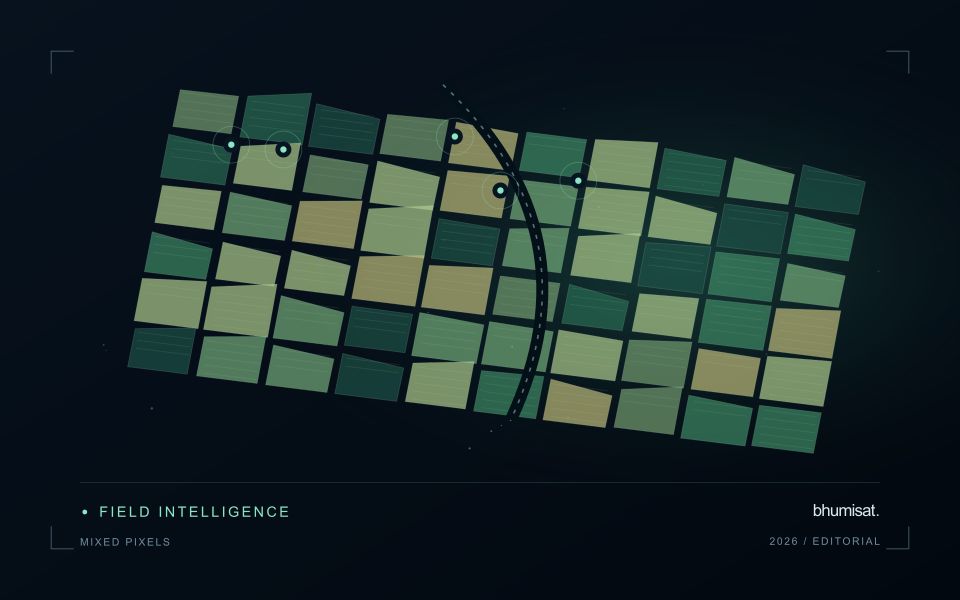
This working guide considers near-infrared observations of vegetation and land in tea plantation sections. The immediate decision is to coordinate inspections with plucking cycles. Useful reference evidence includes plucking dates, pruning history and section-level canopy notes. The case is an illustrative planning context, with assumptions to check against the actual sensor, landscape and project requirements.
The setting: Tea plantation sections
Tea plantations are divided into management sections whose appearance can change with plucking, pruning, replanting and seasonal growth. A recently worked section may differ sharply from an adjacent section even when both are being managed as intended. Connect the image record to the operation calendar before interpreting these differences. Section boundaries, access roads and the location of shade or shelter vegetation are important because they define which surfaces contribute to each summary.
A time series is most informative when comparisons account for these management events. Consider whether the intended service is tracking recovery after pruning, supporting inspections or studying broader seasonal vegetation patterns. Each objective calls for a different reference timeline. On sloping land, examine illumination and shadow effects as well as cloud quality. An apparent change should remain traceable to the acquisition and the area that contributed valid observations.
Field records should identify the section, tea growth condition, recent operations and any measurements used to investigate a flagged pattern. If production is the target, the relationship with harvested leaf records must be evaluated for the relevant management system and period. A general canopy index cannot establish leaf quality or yield by itself. The useful initial product is often a transparent comparison that helps estate staff decide where a closer assessment would add value.
Understand what contributes to the NIR response
Near-infrared wavelengths lie outside the range of human vision, but they are important in optical observations of vegetation and land. A near-infrared image should not be confused with a thermal image. Reflected sunlight in this region and emitted thermal radiation describe different physical processes. This distinction matters when communicating crop information: a bright or dark NIR response is not a direct temperature reading. Its interpretation depends on the surface, the observation geometry and the particular wavelength interval measured by the instrument.
Vegetation can show a strong near-infrared response because of interactions within leaves and canopies. At landscape scale, the observed signal also changes with canopy cover, leaf arrangement, shadows and the proportion of visible soil or water. A field with a different crop age may therefore differ substantially from another field without either being abnormal. NIR is useful partly because it adds contrast beyond visible appearance, but that contrast still needs a meaningful comparison. The analytical task determines which associated measurements and field records are required.
Use NIR in a traceable analytical chain
When combining NIR with another band in an index or model, check that the channels refer to comparable ground locations and acquisition conditions. Differences in band resolution, alignment or spectral response can influence the result. Preserve reflectance scale factors, quality flags and any processing applied before the combination. Where resampling is necessary, choose a documented common grid and recognise that the operation changes representation rather than increasing the original observation detail. These controls are particularly important near field edges and in small management units.
An application should demonstrate the benefit of the NIR measurement using evidence appropriate to its stated purpose. For vegetation monitoring, that might mean a relationship with independently recorded canopy conditions or a reliable separation of relevant land-cover classes. For water or soil interpretation, a different protocol may be needed. Review errors as well as successful examples and retain cases that challenge the initial explanation. A clear observation chain makes NIR a useful part of a broader decision process without assigning the band capabilities it does not independently provide.
Prioritise alerts using evidence and consequence
An alert is a request for attention, so its design should consider both the evidence available and the cost of responding. Begin by distinguishing a measured change, a proposed interpretation, and the action expected from the recipient. A large numerical difference is not automatically the most urgent case. The significance of the location, the age of the observation, the confidence in the interpretation, and the consequences of delay can all influence priority.
Create a review queue with enough context to support consistent decisions. Useful information can include the supporting dates, quality qualifications, previous observations, geographic unit, and the reason the case entered the queue. Define when an alert can be closed, escalated, or held for another observation. A documented rule is easier to improve than an informal practice that depends entirely on the memory of the operator reviewing the result.
Collect feedback from inspections and operational responses. Record alerts that led to a useful finding, alerts that required no action, and important conditions that the system failed to flag. Review these outcomes across different settings rather than relying only on a total count of alerts. The objective is a queue that directs limited attention towards meaningful decisions, while generating evidence for adjusting thresholds, improving context, and reducing repeated sources of unnecessary work.
Budget the complete processing workflow
A processing budget should cover the complete path from source observations to a maintained product. Data access and computing are only part of that path. Include preparation, geographic updates, reference collection, expert review, delivery, and support where those activities belong to the service. A calculation that runs cheaply on a small demonstration can still require substantial effort when the surrounding work is repeated across many locations.
Measure representative tasks rather than assuming that every observation costs the same amount to process. Record data volume, processing time, retry frequency, manual interventions, and the conditions that create unusually demanding cases. Separate fixed setup work from work that grows with the number of observations or users. These records support decisions about batching, caching, storage policy, and the point at which a different processing design becomes worthwhile.
Connect the budget to a defined level of service. Faster delivery, more frequent observation, broader coverage, or more detailed review can each change the resources required. Describe these trade-offs before promising a delivery pattern that the workflow has not demonstrated. Review the budget using operational evidence and preserve enough detail to understand changes between processing versions. The aim is a sustainable service whose resource choices remain aligned with the information that users value.
Bring the evidence back to the decision
A strong interpretation states what was observed, which explanations remain plausible, and what additional evidence would help distinguish them. Avoid presenting a convenient label as a confirmed cause when the measurements support only a broader pattern. Connect the proposed next step to the significance of the decision and the confidence available. This creates an interpretation that a field team, analyst, or project partner can examine, challenge, and improve as further observations become available.
Sources & further reading
Explore the bhumisat spacecraft concept and our vision towards 2030, or return to the journal.