Every observation and interpretation contains uncertainty, but the sources and consequences of that uncertainty differ between applications. Some arise from acquisition conditions, others from reference measurements, processing choices, or the transfer of a model to a new setting. This perspective examines how those sources affect the decision a user is considering. It encourages teams to describe uncertainty in a form that can influence action, rather than adding a generic qualification at the end of a report. The objective is to support proportionate decisions while keeping the limits of the available evidence understandable.
This working guide considers near-infrared observations of vegetation and land within cloud-based analysis teams. The immediate decision is to make analytical results reproducible. Useful reference evidence includes input versions, processing parameters and independent product checks. The case is an illustrative planning context, with assumptions to check against the actual sensor, landscape and project requirements.
The setting: Cloud-based analysis teams
A cloud-based analysis team needs to connect a scientific method with repeatable processing and an interpretable result. The same nominal dataset can produce different outputs when input versions, masks, resampling choices or analytical parameters differ. Begin by defining the product and the decisions it is intended to support. A visually successful demonstration is useful, but it does not establish that the workflow will behave consistently across regions, seasons or repeated processing runs.
The processing record should identify input observations, acquisition times, quality screening, software or method versions and the parameters relevant to interpretation. Preserve missing-data conditions and distinguish an analytical result from a task that merely completed without a technical error. For field-level products, boundary versions and the spatial support used for summaries also matter. These details make it possible to explain why two apparently similar runs produced different maps or numerical values.
Validation should include checks of both the analytical claim and the delivery process. Compare representative outputs with suitable reference observations, and test whether another operator can reproduce the result from the recorded inputs. Retain limitations in the product metadata rather than relying on informal knowledge held by one team member. A dependable cloud service makes a chain of evidence accessible, allowing users to understand what was observed, how it was processed and which conclusions the available validation supports.
Understand what contributes to the NIR response
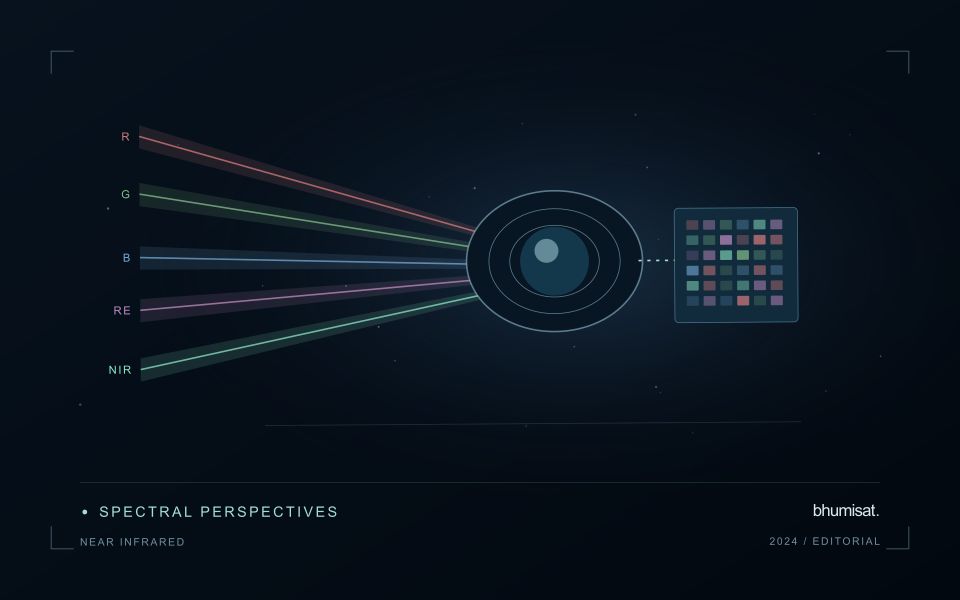
Near-infrared wavelengths lie outside the range of human vision, but they are important in optical observations of vegetation and land. A near-infrared image should not be confused with a thermal image. Reflected sunlight in this region and emitted thermal radiation describe different physical processes. This distinction matters when communicating crop information: a bright or dark NIR response is not a direct temperature reading. Its interpretation depends on the surface, the observation geometry and the particular wavelength interval measured by the instrument.
Vegetation can show a strong near-infrared response because of interactions within leaves and canopies. At landscape scale, the observed signal also changes with canopy cover, leaf arrangement, shadows and the proportion of visible soil or water. A field with a different crop age may therefore differ substantially from another field without either being abnormal. NIR is useful partly because it adds contrast beyond visible appearance, but that contrast still needs a meaningful comparison. The analytical task determines which associated measurements and field records are required.
Use NIR in a traceable analytical chain
When combining NIR with another band in an index or model, check that the channels refer to comparable ground locations and acquisition conditions. Differences in band resolution, alignment or spectral response can influence the result. Preserve reflectance scale factors, quality flags and any processing applied before the combination. Where resampling is necessary, choose a documented common grid and recognise that the operation changes representation rather than increasing the original observation detail. These controls are particularly important near field edges and in small management units.
An application should demonstrate the benefit of the NIR measurement using evidence appropriate to its stated purpose. For vegetation monitoring, that might mean a relationship with independently recorded canopy conditions or a reliable separation of relevant land-cover classes. For water or soil interpretation, a different protocol may be needed. Review errors as well as successful examples and retain cases that challenge the initial explanation. A clear observation chain makes NIR a useful part of a broader decision process without assigning the band capabilities it does not independently provide.
Budget the complete processing workflow
A processing budget should cover the complete path from source observations to a maintained product. Data access and computing are only part of that path. Include preparation, geographic updates, reference collection, expert review, delivery, and support where those activities belong to the service. A calculation that runs cheaply on a small demonstration can still require substantial effort when the surrounding work is repeated across many locations.
Measure representative tasks rather than assuming that every observation costs the same amount to process. Record data volume, processing time, retry frequency, manual interventions, and the conditions that create unusually demanding cases. Separate fixed setup work from work that grows with the number of observations or users. These records support decisions about batching, caching, storage policy, and the point at which a different processing design becomes worthwhile.
Connect the budget to a defined level of service. Faster delivery, more frequent observation, broader coverage, or more detailed review can each change the resources required. Describe these trade-offs before promising a delivery pattern that the workflow has not demonstrated. Review the budget using operational evidence and preserve enough detail to understand changes between processing versions. The aim is a sustainable service whose resource choices remain aligned with the information that users value.
Maintain the geographic units of analysis
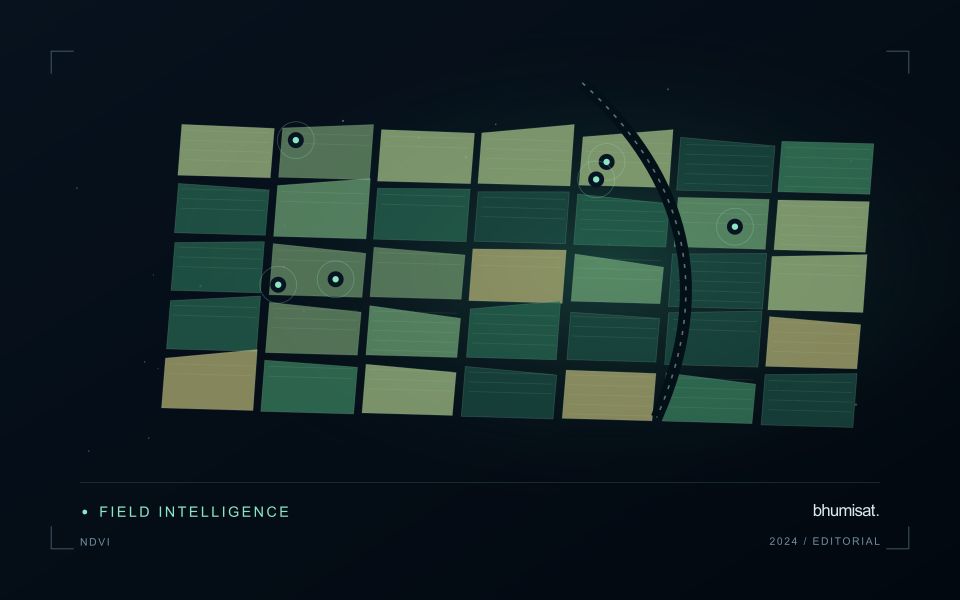
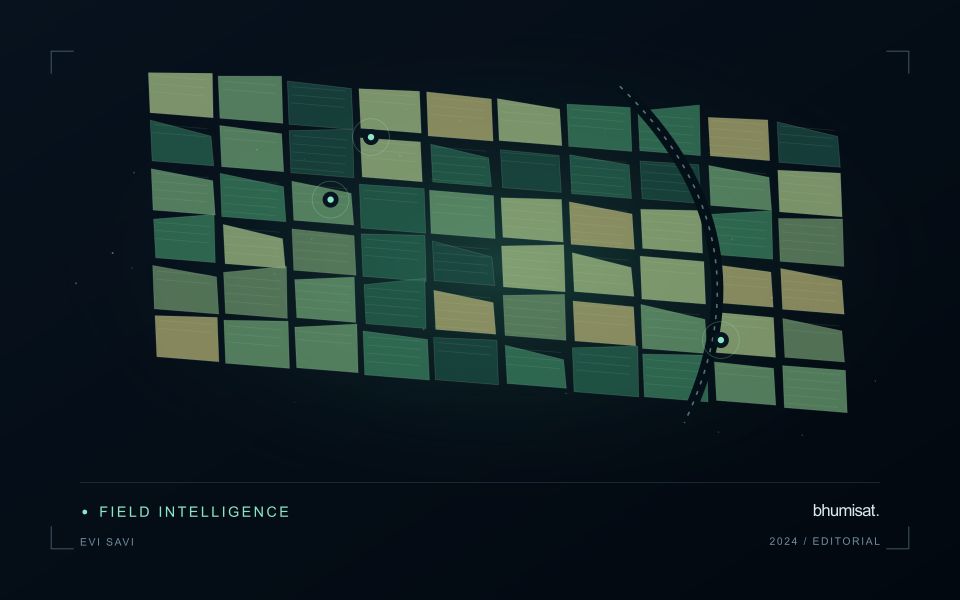
Many observation services summarise measurements within a field, management block, catchment, forest unit, or other mapped boundary. The meaning of that summary depends on whether the boundary accurately represents the unit being discussed. Start with a clear source for the geometry and record its date, coordinate reference, and intended use. A boundary drawn for visual orientation may require additional checking before it becomes a measurement unit.
Inspect overlaps, gaps, narrow fragments, and features that may have changed since mapping. A geometrically valid polygon can still describe an outdated operational unit. Ask the responsible team how divisions, mergers, new infrastructure, and management changes are recorded. Where pixels or reference measurements cross a boundary, define how they are assigned or excluded so that results remain comparable between analysts and processing runs.
Version the boundaries alongside the observations. If a unit changes, preserve a relationship between the previous and revised geometry rather than replacing the history without explanation. Comparisons through time should identify whether they use a constant spatial unit or the operational units valid at each date. This makes it easier to distinguish a change in the measured surface from a change introduced by the geography used to summarise it.
Bring the evidence back to the decision
Useful uncertainty communication identifies the limitation, explains how it could affect the result, and connects it to a practical response. Some decisions can proceed with a qualified estimate; others require another observation or an independent check. Preserve uncertainty information through processing and delivery so that it is available at the point of use. This makes the analysis more accountable and gives the team a clearer basis for deciding which additional evidence would most improve the outcome.
Sources & further reading
Explore the bhumisat spacecraft concept and our vision towards 2030, or return to the journal.