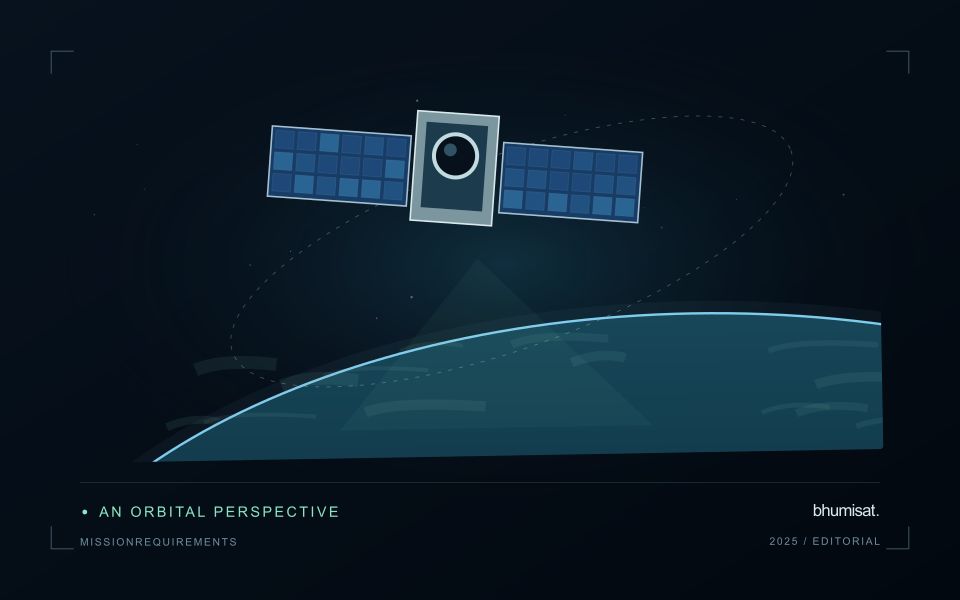
A useful observation programme begins with a decision that somebody can act on. Before selecting imagery or instruments, define the area of interest, the people responsible for inspecting it, and the time available for a response. This planning perspective connects remote measurements with the practical questions that shape a survey or monitoring service. The aim is to identify which observations would change a decision, how supporting evidence would be collected, and what should happen when information is incomplete. A clear plan makes later technical choices easier to assess against an operational purpose.
This working guide considers near-infrared observations of vegetation and land in banana plantation units. The immediate decision is to identify plantation units for closer review. Useful reference evidence includes plant age mixture, canopy continuity and dated field inspections. The case is an illustrative planning context, with assumptions to check against the actual sensor, landscape and project requirements.
Understand what contributes to the NIR response
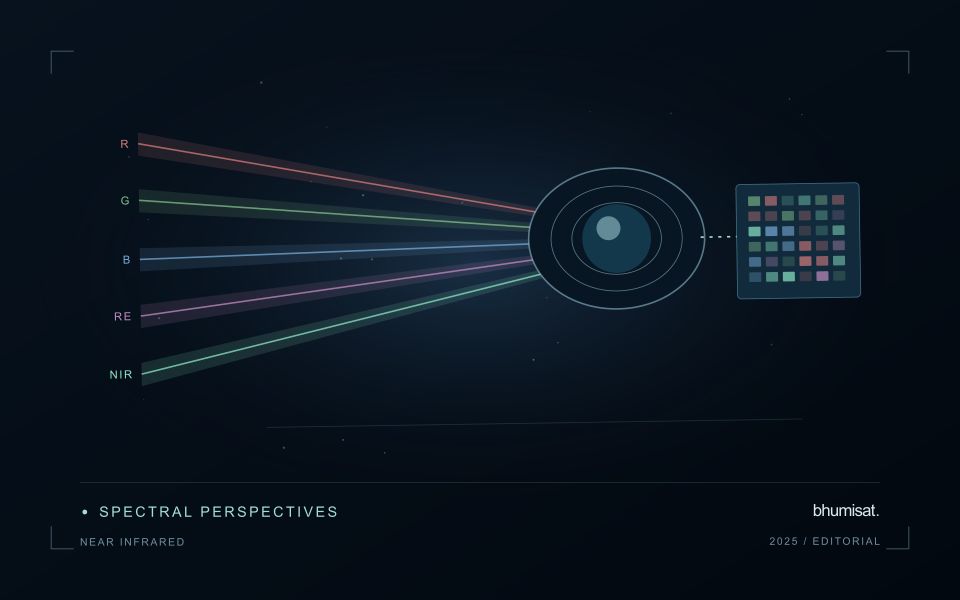
Near-infrared wavelengths lie outside the range of human vision, but they are important in optical observations of vegetation and land. A near-infrared image should not be confused with a thermal image. Reflected sunlight in this region and emitted thermal radiation describe different physical processes. This distinction matters when communicating crop information: a bright or dark NIR response is not a direct temperature reading. Its interpretation depends on the surface, the observation geometry and the particular wavelength interval measured by the instrument.
Vegetation can show a strong near-infrared response because of interactions within leaves and canopies. At landscape scale, the observed signal also changes with canopy cover, leaf arrangement, shadows and the proportion of visible soil or water. A field with a different crop age may therefore differ substantially from another field without either being abnormal. NIR is useful partly because it adds contrast beyond visible appearance, but that contrast still needs a meaningful comparison. The analytical task determines which associated measurements and field records are required.
Use NIR in a traceable analytical chain
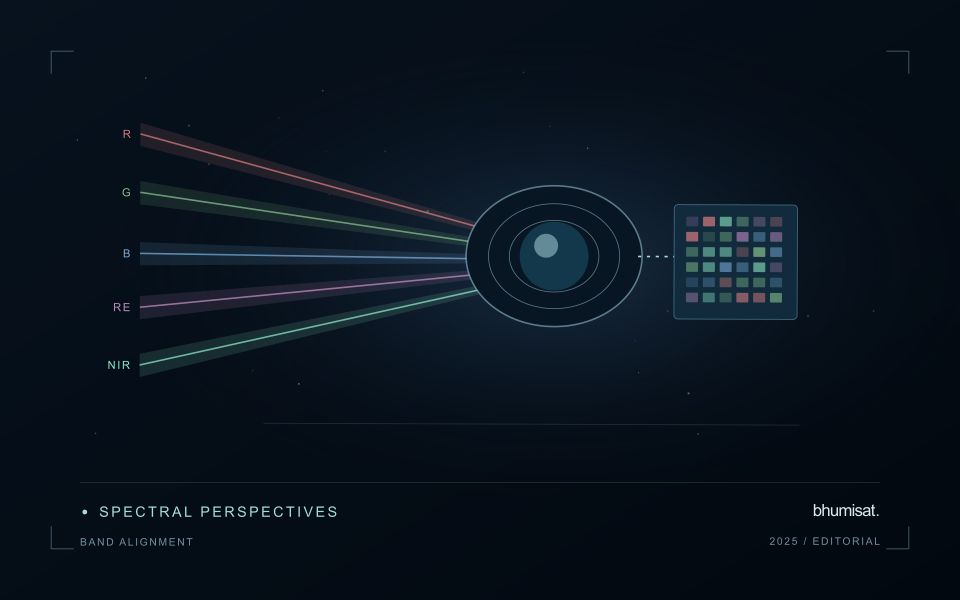
When combining NIR with another band in an index or model, check that the channels refer to comparable ground locations and acquisition conditions. Differences in band resolution, alignment or spectral response can influence the result. Preserve reflectance scale factors, quality flags and any processing applied before the combination. Where resampling is necessary, choose a documented common grid and recognise that the operation changes representation rather than increasing the original observation detail. These controls are particularly important near field edges and in small management units.
An application should demonstrate the benefit of the NIR measurement using evidence appropriate to its stated purpose. For vegetation monitoring, that might mean a relationship with independently recorded canopy conditions or a reliable separation of relevant land-cover classes. For water or soil interpretation, a different protocol may be needed. Review errors as well as successful examples and retain cases that challenge the initial explanation. A clear observation chain makes NIR a useful part of a broader decision process without assigning the band capabilities it does not independently provide.
The setting: Banana plantation units
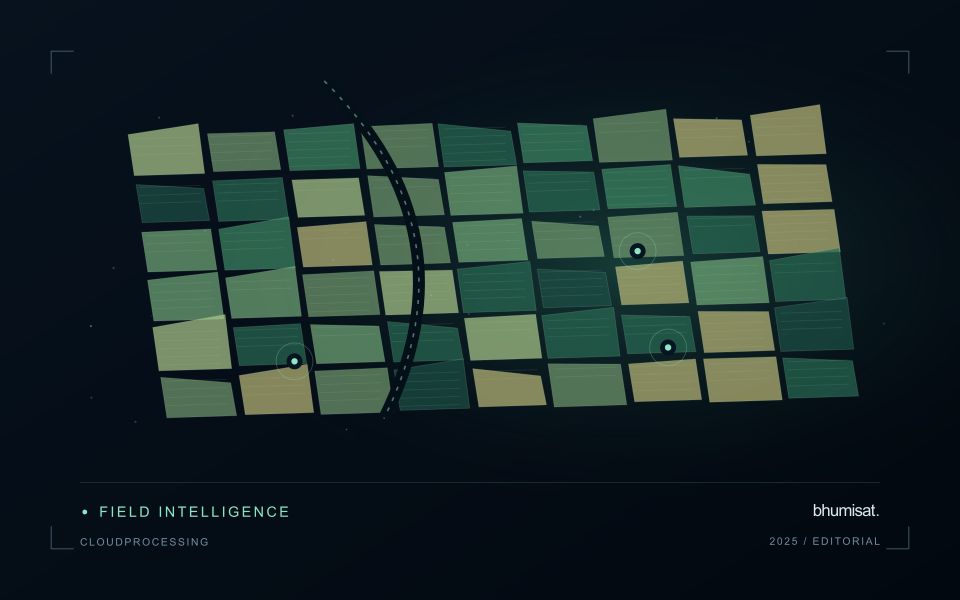
Banana production units can contain plants at different stages within a continuously managed system. Replanting, harvesting, leaf management and weather effects can change the canopy pattern at a local scale. A monitoring service should account for that mixture rather than expecting every unit to follow one simple seasonal curve. Define the management boundaries and record how stages are organised within them before interpreting a difference between neighbouring plantation areas.
In humid settings, clouds and shadows can reduce the number of usable optical observations. Retain those gaps explicitly and examine whether the information remains current enough for the intended inspection process. Plantation roads, drainage features and open replacement areas can influence a unit average. Where the proposed output is more detailed than the underlying image support, consider a broader summary or complementary field and drone observations instead of implying plant-level certainty.
Field teams should record stage mixture, canopy condition, recent management and visible events relevant to the sampled area. A vegetation anomaly may justify a visit, but it cannot identify a specific disease or establish production loss on its own. Evaluate models and inspection priorities against representative observations, including normal-looking units. Reports should distinguish the remotely observed pattern from the explanation established during follow-up, allowing plantation staff to use both sources of evidence appropriately.
Locate the uncertainty that matters to the decision
An uncertainty budget is a practical description of where a result could become unreliable. Begin with the observation chain: acquisition, calibration, geographic matching, reference measurements, feature calculation, modelling, and delivery. Identify the assumptions at each stage and ask which could materially change the interpretation. The purpose is not to assign a precise number to every limitation. It is to locate the sources that deserve attention for the intended decision.
Separate limitations that can be measured from those that currently require a qualitative description. Repeated measurements may help characterise variability, while comparisons with independent references can reveal systematic differences. Some uncertainties interact, so combining individual error estimates without examining their relationships can produce a misleading impression of precision. Keep the method of assessment visible and avoid treating an unexamined assumption as though it were a negligible contribution.
Use the budget to prioritise further work. The largest visible source of variation is not always the one whose reduction would most improve the decision. Consider which additional observation, test, or contextual record would change confidence in an actionable way. Revisit the budget when the application, observation source, or deployment conditions change. This turns uncertainty analysis into a guide for improving the workflow rather than a qualification added only after the result has been delivered.
Budget the complete processing workflow
A processing budget should cover the complete path from source observations to a maintained product. Data access and computing are only part of that path. Include preparation, geographic updates, reference collection, expert review, delivery, and support where those activities belong to the service. A calculation that runs cheaply on a small demonstration can still require substantial effort when the surrounding work is repeated across many locations.
Measure representative tasks rather than assuming that every observation costs the same amount to process. Record data volume, processing time, retry frequency, manual interventions, and the conditions that create unusually demanding cases. Separate fixed setup work from work that grows with the number of observations or users. These records support decisions about batching, caching, storage policy, and the point at which a different processing design becomes worthwhile.
Connect the budget to a defined level of service. Faster delivery, more frequent observation, broader coverage, or more detailed review can each change the resources required. Describe these trade-offs before promising a delivery pattern that the workflow has not demonstrated. Review the budget using operational evidence and preserve enough detail to understand changes between processing versions. The aim is a sustainable service whose resource choices remain aligned with the information that users value.
Bring the evidence back to the decision
The practical outcome should be a short observation plan that another team can follow. It should name the decision, the required evidence, the responsible roles, and the conditions that trigger a field visit or further analysis. Keep the plan small enough to test, then revise it using the results of real inspections. A useful monitoring workflow improves because its assumptions are examined systematically, and its observations remain connected to decisions throughout the process.
Sources & further reading
Explore the bhumisat spacecraft concept and our vision towards 2030, or return to the journal.