An analytical result becomes operational information only when the receiving team can understand it and use it within existing responsibilities. Handoffs often fail because assumptions that were obvious to the analyst are absent from the delivered product. This perspective considers the information needed at that boundary: acquisition time, processing status, geographic scope, quality qualifications, and the action expected from the recipient. It also asks how corrections and feedback should return to the producing team. A dependable handoff creates a shared understanding of the result, rather than merely transferring a file.
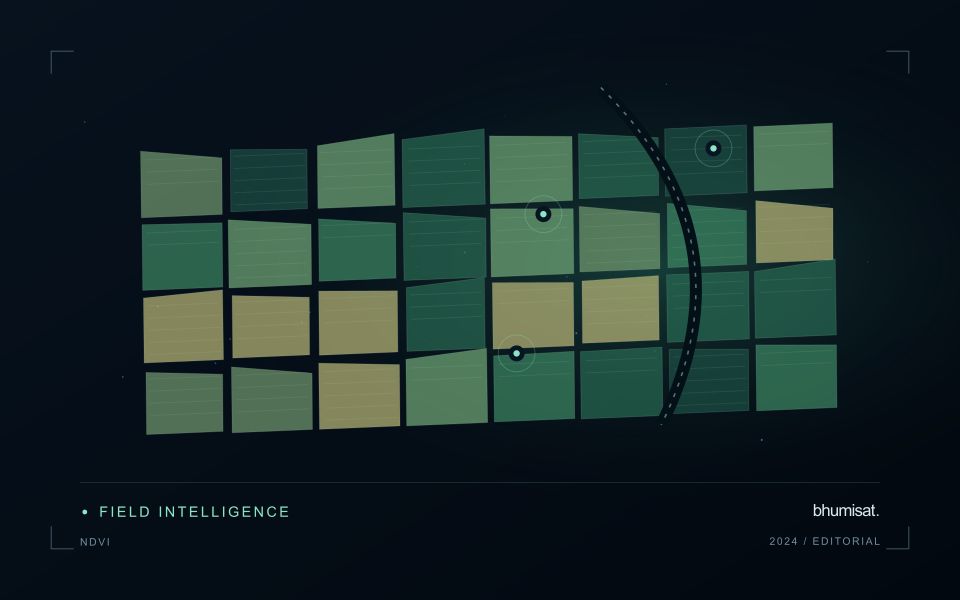
This working guide considers ndvi crop monitoring across wheat growing areas. The immediate decision is to review fields with unusual seasonal timing. Useful reference evidence includes sowing dates, crop stage and representative field observations. The case is an illustrative planning context, with assumptions to check against the actual sensor, landscape and project requirements.
The setting: Wheat growing areas
A wheat monitoring programme should begin with a clear description of its production setting. Sowing windows, variety choices, water supply and management practices can vary across a region. Fields at different developmental stages should not be judged against a single image threshold as though they followed one uniform calendar. A useful field register combines boundaries with sowing information and a record of the operations that can influence the observed canopy through the season.
Repeated observations can help describe the timing and spatial consistency of crop development. Inspect the quality of each acquisition and distinguish persistent patterns from a single questionable measurement. Field margins, tracks, bare patches and neighbouring crops can affect irregular or narrow units. Where comparisons involve different image products, make sure the processing and spatial support are suitable before interpreting a numerical difference as a crop response.
The field investigation should follow a defined question, such as whether a section has uneven establishment or a different development stage from its peers. Record the evidence used to resolve that question, including places where the image alert did not correspond to an actionable condition. If a model estimates harvest outcomes, evaluate it against appropriate production records and separate training from assessment. The reporting system should communicate uncertainty alongside the spatial pattern that prompted attention.
What the index can describe
NDVI expresses the contrast between near-infrared and red reflectance as their difference divided by their sum. The result is a compact description of spectral behaviour, rather than a direct measurement of crop health. A growing canopy often changes both of these measurements, but soil exposure, standing water, illumination and the mixture of materials inside a pixel can also affect the index. An operational interpretation therefore starts with the crop, its development stage and the surface actually represented by the pixels.
A useful monitoring baseline describes comparable conditions. Comparing a newly planted field with an older field can produce a strong difference that simply reflects age. Comparing the same field before and after harvest can be useful if the management record confirms the event. The analytical question should be stated before choosing an alert threshold: detecting an unexpected departure from normal development is different from mapping current canopy cover. Neither task automatically establishes the cause of a low value or the action a grower should take.
Build a comparison that can be checked
Before computing field statistics, screen unsuitable observations and retain their quality information. The processing record should identify the imagery source, acquisition date, reflectance product, band mapping and mask rules. Report how much valid area remains inside each field. A median calculated from a small cloud-free corner should not be presented as if it represented the entire management block. Keeping a distribution or selected percentiles alongside the central value can reveal variation that a single coloured label would hide from the user.
Validation should connect an apparent change with an independent observation at a relevant time. A field team can record canopy condition, crop stage, recent operations and any visible disturbance, including observations that contradict the alert. Revisit both flagged and apparently normal areas to evaluate missed changes and false alarms. Once a relationship has been demonstrated, monitor whether it remains stable across seasons and management systems. NDVI is most useful when it helps organise a defensible comparison and directs attention to places where additional information is needed.
Design field observations around the information need
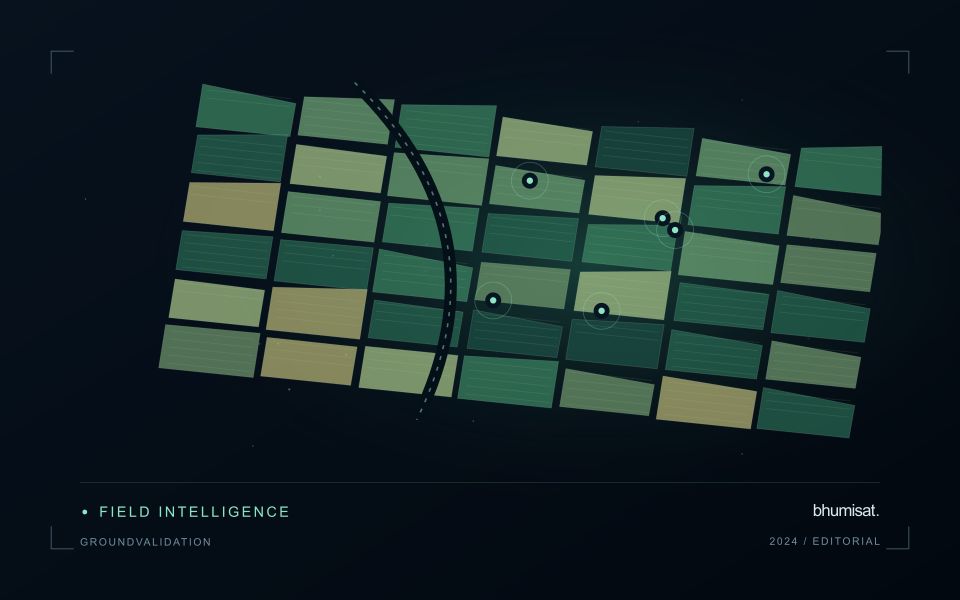
Field observations are most useful when they answer a defined question within the monitoring workflow. Begin by identifying the variable, condition, or management event that needs to be recorded and the geographic unit to which it applies. Distinguish direct measurements from an observer's interpretation. A consistent record of crop stage, management timing, and visible conditions can provide valuable context even when the field team is not collecting a complex set of measurements.
Prepare a collection protocol that reflects the variability of the site. Define where observations are made within a unit, how many locations are represented, and how the position and time are recorded. Avoid selecting only the most dramatic or convenient examples. Include apparently normal conditions and records that might challenge the remote interpretation. Where a measurement method has known limitations, preserve the information needed to assess whether those limitations affect the intended comparison.
Link field records to the corresponding remote observations without losing their original detail. Geographic matching, timing, and the scale represented by each record should remain visible. Review disagreements with the collecting team before changing a label or excluding an observation. A disagreement may reveal a timing mismatch, a mixed surface, or an incomplete interpretation rather than a simple error. The field programme should improve the understanding of the monitoring process as well as provide evidence for evaluating its outputs.
Translate the decision into observation requirements
Start with the decision that the information is intended to support. Describe the geographic unit, the time available for acting, and the consequence of an incorrect interpretation. A requirement such as detecting an unusual pattern across management blocks is different from identifying its cause. Keeping that distinction explicit helps a team select measurements that are relevant to the application and prevents later evaluation from drifting towards whatever result happens to be easiest to demonstrate.
Build a compact requirements matrix linking each decision to the evidence needed, the proposed observation source, and an acceptance condition. Include geographic accuracy, temporal relevance, quality screening, and the context required for interpretation. The matrix should also identify the evidence used to justify each requirement. An engineering preference or a convenient data source can inform a study, but neither should silently replace a documented information need.
Review the matrix with the people who will use the result. Ask how their response would change when information is delayed, incomplete, or uncertain. Record unresolved requirements as questions for a pilot rather than converting them into confident specifications. This produces a practical framework for comparing technical options, designing tests, and explaining why an observation is useful to the intended workflow.
Bring the evidence back to the decision
A successful handoff leaves the recipient with a clear result, sufficient context, and a practical route for raising questions. Test the delivery with the people who will use it, including how they respond when observations are missing or qualified. Capture their feedback as evidence for improving the product. The most useful delivery format is the one that preserves the relevant technical meaning while fitting the decisions, time constraints, and responsibilities of its intended audience.
Sources & further reading
Explore the bhumisat spacecraft concept and our vision towards 2030, or return to the journal.