A method that produces a plausible result has not automatically demonstrated that it works for its intended users. Validation requires a defined question, suitable reference evidence, and an evaluation design that reflects how the method will be used. This perspective examines which observations should be compared, how they should be sampled, and which errors matter in practice. It also considers the difference between evidence used to develop a method and evidence reserved for evaluating it. The objective is a test that can reveal weaknesses as well as confirm useful performance.
This working guide considers testing whether a remote sensing model transfers in sugarcane production blocks. The immediate decision is to sequence scouting and harvest review. Useful reference evidence includes planting or ratoon dates and dated canopy observations. The case is an illustrative planning context, with assumptions to check against the actual sensor, landscape and project requirements.
Identify what changes between domains
A model trained on one region or season learns relationships present in its development data. Applying it elsewhere assumes those relationships remain useful. New crop varieties, forest types, soil colours, management practices, illumination, or sensor characteristics can violate that assumption. Define the intended transfer explicitly: a new district, another year, another sensor, or a different class distribution. Each change creates a different test. A model that transfers across nearby fields has not thereby demonstrated reliable performance across climates or observation systems.
Keep the measurement pipeline consistent before attributing differences to the model. Reflectance scaling, band order, cloud masking, spatial resolution, composite windows, and missing value handling can all change predictions. Sensors with similarly named bands may have different spectral responses. Harmonization can reduce some differences but does not establish equivalence for every target. Examine predictor distributions, missing data rates, and examples from the new setting. Flag inputs outside the conditions represented during training so that extrapolation remains visible.
Test the destination, then adapt carefully
Design evaluation splits around the intended deployment. Hold out geographic regions to test spatial transfer and later years to test temporal transfer, keeping neighboring samples or repeated observations of the same site together when needed. Report performance for meaningful destination groups rather than only a pooled score. Class prevalence affects some metrics, so interpret changes alongside the underlying confusion matrix or residual distributions. A random pixel split can look excellent while providing little evidence about performance in an unseen region.
If local labels are available, reserve a destination assessment set before fine tuning or recalibration. Use the remaining observations to compare straightforward baselines with more complex adaptation methods. Check whether improvement comes from genuine transfer or simply from adding representative local data. Retain an option to withhold predictions when input quality or novelty makes them unreliable. Document the training domain, destination evidence, preprocessing versions, and conditions where use is unsupported. Continue monitoring once new observations arrive, since seasonal and environmental shifts can emerge after an initial evaluation. Transferability is a measured property of a particular model, workflow, target, and destination; it should not be inferred from architecture name or strong performance on the original test set.
The setting: Sugarcane production blocks
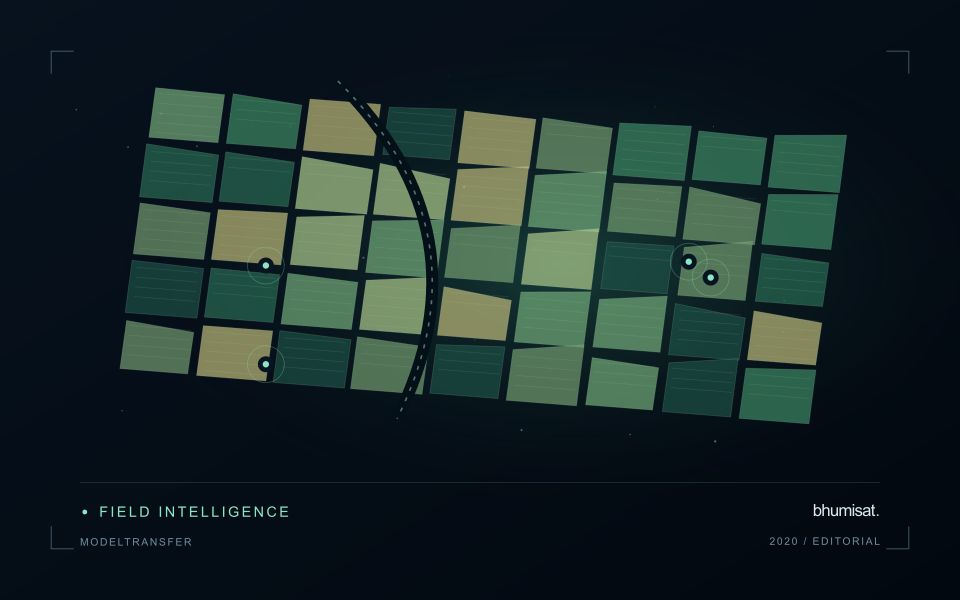
Sugarcane monitoring depends on knowing where each block sits within a management cycle. A recently planted field, an established ratoon and a block approaching harvest can have very different canopy structures without any of them indicating a problem. Maintain planting and harvest dates alongside block boundaries, and distinguish crop establishment from regrowth. This context gives a time series a meaningful starting point and prevents comparisons between fields at unrelated stages.
A useful workflow follows the development of each block through successive quality-screened observations. Look for departures from comparable blocks or from a documented local seasonal pattern, rather than applying a single threshold across the whole estate. Harvest operations, residue management, bare soil and weeds can all affect the surface signal. Track these events in the same record as the imagery so that the analytical timeline reflects what actually happened on the ground.
Field validation should address a defined question, such as whether a flagged area has uneven establishment or requires an agronomic visit. Record crop stage, stand continuity, management history and the location of observations within the block. Predictions related to production need suitable harvest measurements and evaluation across seasons. A map that helps organise scouting is useful evidence of a workflow; it is not automatically a validated estimate of cane tonnage.
Represent gaps without inventing observations
A monitoring sequence often contains periods without a usable observation. The reason may be cloud, shadow, missing coverage, a failed transfer, or a quality condition that excludes the data. Begin by representing these states explicitly. A missing observation is different from a low measurement, an unchanged surface, or a confirmed absence of the feature being studied. The distinction should survive both the analysis and the presentation of the result.
Define when a temporal gap is acceptable for the intended decision. A workflow may continue using the latest qualified observation, request another source, or suspend an alert until sufficient evidence is available. Whichever response is selected, show the age of the supporting observation. If interpolation is used for a suitable analytical purpose, preserve the distinction between an estimated value and a directly observed measurement, together with the assumptions needed to interpret it.
Review how gaps affect the coverage of the final evaluation. Locations with frequent missing data may differ systematically from those with regular observations. A performance estimate based only on clear, complete records can therefore describe a narrower population than the service is expected to support. Report usable coverage alongside analytical results and use recurring gaps to guide acquisition planning, reference collection, and the selection of complementary observation methods.
Maintain the geographic units of analysis
Many observation services summarise measurements within a field, management block, catchment, forest unit, or other mapped boundary. The meaning of that summary depends on whether the boundary accurately represents the unit being discussed. Start with a clear source for the geometry and record its date, coordinate reference, and intended use. A boundary drawn for visual orientation may require additional checking before it becomes a measurement unit.
Inspect overlaps, gaps, narrow fragments, and features that may have changed since mapping. A geometrically valid polygon can still describe an outdated operational unit. Ask the responsible team how divisions, mergers, new infrastructure, and management changes are recorded. Where pixels or reference measurements cross a boundary, define how they are assigned or excluded so that results remain comparable between analysts and processing runs.
Version the boundaries alongside the observations. If a unit changes, preserve a relationship between the previous and revised geometry rather than replacing the history without explanation. Comparisons through time should identify whether they use a constant spatial unit or the operational units valid at each date. This makes it easier to distinguish a change in the measured surface from a change introduced by the geography used to summarise it.
Bring the evidence back to the decision
The validation record should explain the population represented by the test, the reference observations used, and the limitations of the comparison. Report meaningful errors alongside useful successes, and retain examples that challenge the method. Treat wider deployment as a new opportunity to evaluate transfer across relevant conditions. A well-designed validation programme gives users a defensible basis for deciding where the method is useful, where additional evidence is needed, and where another approach may be appropriate.
Sources & further reading
Explore the bhumisat spacecraft concept and our vision towards 2030, or return to the journal.