Comparisons through time are valuable only when the observations are sufficiently comparable for the question being asked. A difference between dates can reflect real change, a normal stage in a seasonal cycle, or a difference in how the surface was observed. This perspective examines the reference period, the timing of acquisitions, and the contextual records needed to interpret a sequence. It encourages the use of appropriate baselines rather than treating every previous observation as an equivalent benchmark. The objective is to identify changes that remain meaningful after normal variation and measurement conditions are considered.
This working guide considers testing whether a remote sensing model transfers along changing sandy shorelines. The immediate decision is to review shoreline positions over time. Useful reference evidence includes acquisition context, field positions and consistent shoreline definitions. The case is an illustrative planning context, with assumptions to check against the actual sensor, landscape and project requirements.
The setting: Changing sandy shorelines
A shoreline is not always one fixed boundary that every observation measures in the same way. The visible water edge, a vegetation boundary and another mapped coastal indicator can represent different features. A monitoring programme should define its chosen shoreline consistently before comparing dates. Tidal conditions, wave state, seasonal beach changes and the geometry of the image can all influence the position recorded, even without a lasting change in the coast.
Spatial resolution and alignment determine the precision with which a boundary can be located. A sharply drawn line on a map should not imply more positional certainty than the observations support. Compare acquisitions under suitable conditions and retain the information needed to examine their differences. Mixed pixels, shadows and narrow coastal features may require manual review or an uncertainty zone rather than an automatic interpretation at every location.
Field validation should use the same shoreline definition as the image analysis and record when and how a position was measured. A visit under different water conditions may represent a different boundary even if its coordinates are accurate. Evaluate change over appropriate distances and periods, and avoid treating every small mapped displacement as erosion or deposition. A transparent product shows the observed positions, their dates and the uncertainty relevant to the decision being considered.
Identify what changes between domains
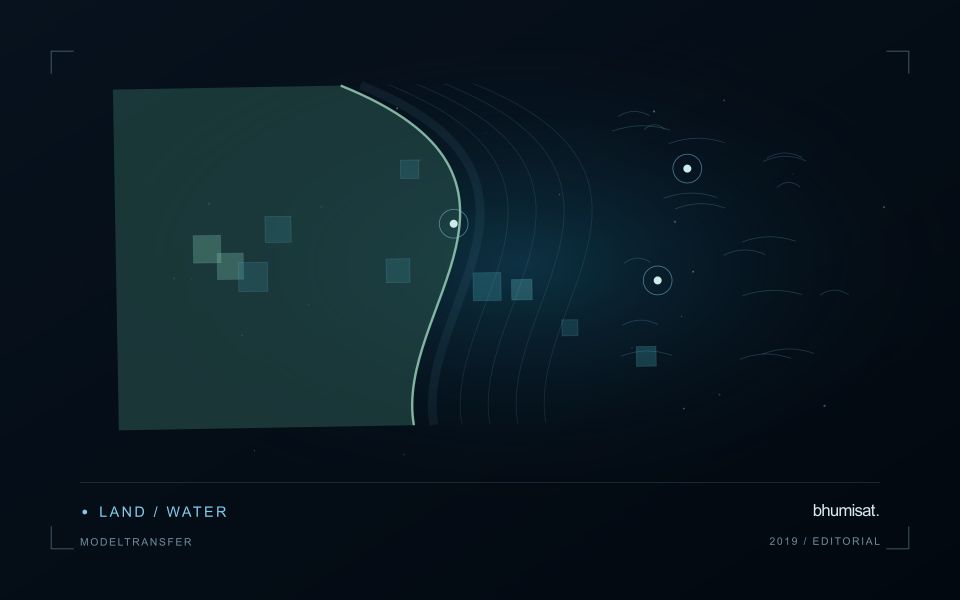
A model trained on one region or season learns relationships present in its development data. Applying it elsewhere assumes those relationships remain useful. New crop varieties, forest types, soil colours, management practices, illumination, or sensor characteristics can violate that assumption. Define the intended transfer explicitly: a new district, another year, another sensor, or a different class distribution. Each change creates a different test. A model that transfers across nearby fields has not thereby demonstrated reliable performance across climates or observation systems.
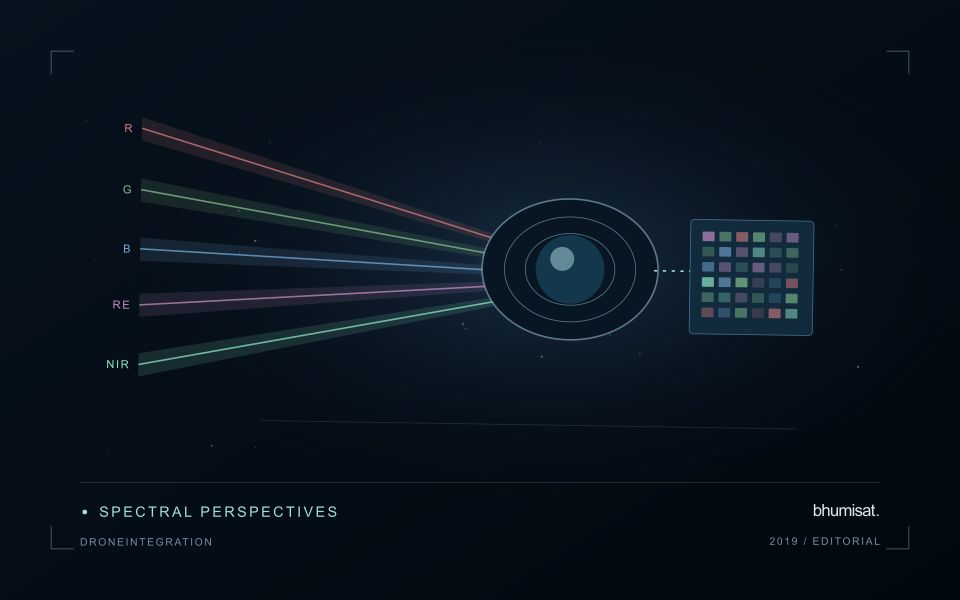
Keep the measurement pipeline consistent before attributing differences to the model. Reflectance scaling, band order, cloud masking, spatial resolution, composite windows, and missing value handling can all change predictions. Sensors with similarly named bands may have different spectral responses. Harmonization can reduce some differences but does not establish equivalence for every target. Examine predictor distributions, missing data rates, and examples from the new setting. Flag inputs outside the conditions represented during training so that extrapolation remains visible.
Test the destination, then adapt carefully
Design evaluation splits around the intended deployment. Hold out geographic regions to test spatial transfer and later years to test temporal transfer, keeping neighboring samples or repeated observations of the same site together when needed. Report performance for meaningful destination groups rather than only a pooled score. Class prevalence affects some metrics, so interpret changes alongside the underlying confusion matrix or residual distributions. A random pixel split can look excellent while providing little evidence about performance in an unseen region.
If local labels are available, reserve a destination assessment set before fine tuning or recalibration. Use the remaining observations to compare straightforward baselines with more complex adaptation methods. Check whether improvement comes from genuine transfer or simply from adding representative local data. Retain an option to withhold predictions when input quality or novelty makes them unreliable. Document the training domain, destination evidence, preprocessing versions, and conditions where use is unsupported. Continue monitoring once new observations arrive, since seasonal and environmental shifts can emerge after an initial evaluation. Transferability is a measured property of a particular model, workflow, target, and destination; it should not be inferred from architecture name or strong performance on the original test set.
Design an evaluation that reflects deployment
A model evaluation should resemble the conditions in which the model will be used. Start by identifying which relationships the development data share: nearby locations, repeated observations of the same unit, common collection teams, or measurements from a single period. These relationships can make records less independent than they appear. An evaluation that ignores them may test the ability to recognise familiar conditions rather than the ability to operate in a new setting.
Choose a split strategy that matches the intended transfer. Holding out locations, seasons, operational units, or acquisition conditions can answer different questions. Document which question each split is designed to address, and keep the held-out evidence separate while selecting features and tuning the method. Repeatedly inspecting the same evaluation set to improve a model gradually makes that set part of development, even if it retains its original label.
Report results at a scale that is meaningful to the user. A strong average can hide poor performance for important subgroups or unusual conditions. Examine error patterns and retain examples of both successful and unsuccessful predictions. Where the evidence covers only a limited range of conditions, describe that range explicitly. The evaluation then becomes a practical guide to suitable use, further testing, and the collection of additional reference observations.
Keep an auditable review record
A review record should explain how a result moved from an analytical output to an accepted interpretation or operational decision. Preserve the product identifier, the evidence considered, the reviewer role, and the outcome of the review. A short, consistent record is often more useful than an extensive free-text note that cannot be compared between cases. The objective is to make important decisions traceable without turning routine review into unnecessary administrative work.
Separate observations from conclusions within the record. Describe the evidence visible to the reviewer, the alternative explanations considered where relevant, and the reason for accepting, qualifying, or rejecting the result. If a correction is required, identify what should change and how the revised product relates to the earlier version. Keep unresolved questions visible so that they can be addressed by another observation or by the person responsible for the next action.
Use the accumulated record to improve the workflow. Recurring review reasons can reveal unclear requirements, missing contextual information, unstable processing steps, or an evaluation gap. Examine whether similar cases receive similar decisions across reviewers and over time. Preserve the relationship between feedback and subsequent revisions so that improvements can be assessed against the evidence that motivated them. An auditable record supports learning, accountability, and consistent delivery while allowing the technical process to evolve.
Bring the evidence back to the decision
A useful comparison preserves the dates, quality conditions, and contextual assumptions behind its baseline. Review unusual results against the actual observation sequence rather than relying entirely on a summary statistic. Where seasonal timing is important, describe how comparable stages were identified. The resulting analysis should help users distinguish an informative change from an expected cycle or an observation artefact, while making gaps and remaining uncertainty visible enough to guide further investigation.
Sources & further reading
Explore the bhumisat spacecraft concept and our vision towards 2030, or return to the journal.