A useful observation programme begins with a decision that somebody can act on. Before selecting imagery or instruments, define the area of interest, the people responsible for inspecting it, and the time available for a response. This planning perspective connects remote measurements with the practical questions that shape a survey or monitoring service. The aim is to identify which observations would change a decision, how supporting evidence would be collected, and what should happen when information is incomplete. A clear plan makes later technical choices easier to assess against an operational purpose.
This working guide considers mixed pixels and field boundary effects in tropical oil-palm estates. The immediate decision is to prioritise block inspections. Useful reference evidence includes dated palm condition observations and management records. The case is an illustrative planning context, with assumptions to check against the actual sensor, landscape and project requirements.
The setting: Tropical oil-palm estates
A tropical oil-palm estate contains blocks with different planting years, canopy closure, drainage conditions and maintenance histories. Their image responses should not be interpreted as though every block were a uniform mature stand. Young palms leave substantial soil and understory visible, while older stands can present a nearly continuous canopy. Begin with a block register that records planting year, boundaries, access routes and the activities that could change the appearance of a block.
Clouds, shadows and persistent haze complicate optical observation in humid landscapes. A reporting period may contain only a few usable measurements, even when several acquisitions were scheduled. Compare blocks using observations that pass the same quality rules, and retain the usable area within each summary. Roads, drains, conservation strips and neighbouring crops should be separated where their mixed contribution would otherwise dominate narrow or irregular management units.
The practical output is an inspection priority, accompanied by an explanation of its supporting evidence. A low vegetation response cannot establish a particular disease, nutrient deficiency or yield outcome on its own. Field teams should record palm age, canopy condition, recent pruning, flooding and any measurements used to investigate an alert. Include apparently normal blocks in these visits so that evaluation covers routine conditions as well as conspicuous anomalies.
A pixel can represent several surface components
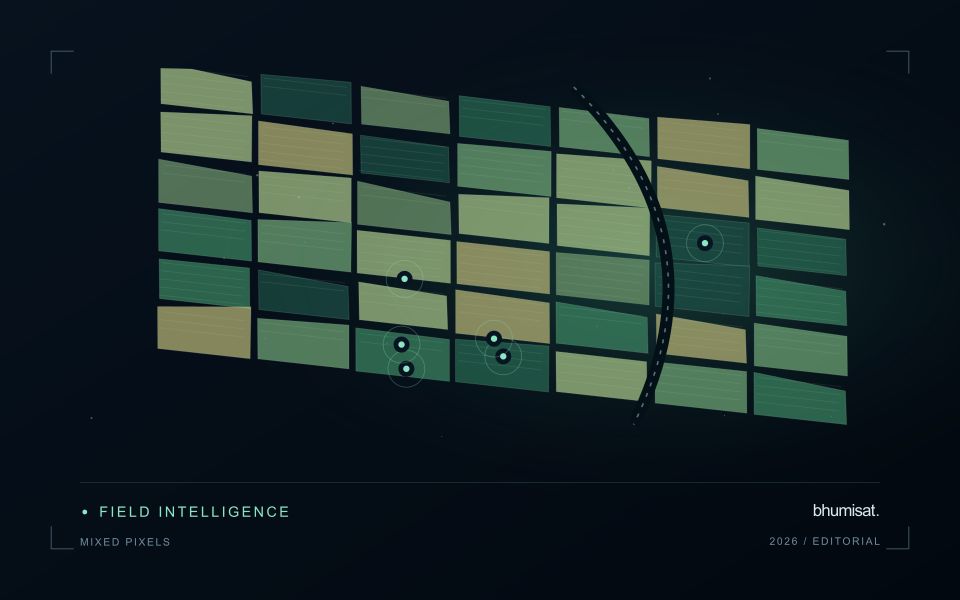
A satellite pixel represents an observation over a ground area, influenced by the instrument's spatial response and the scene within it. That area may contain several materials, such as crop canopy, soil, shade, water or a road. A mixed response is therefore common, especially near boundaries and in fragmented landscapes. It should not be treated automatically as a processing defect. The analytical question is whether the mixture supports the intended interpretation and whether a model trained under one mixture remains applicable under another.
Field geometry affects the number and character of observations available. A compact large field can contain many interior pixels, while a narrow or irregular field may consist mostly of boundary observations. Simply counting pixels does not establish how much independent information a dataset provides. Resampling onto a finer grid also does not remove the original mixing. Before selecting a monitoring product, examine the relationship between field dimensions, relevant landscape features and the measured spatial characteristics of the imagery that will support the service.
Choose a reporting unit that the data can support
Boundary exclusions can help investigate sensitivity to neighbouring surfaces, but they need a consistent rule and a clear purpose. Excluding a fixed distance may remove much of a small field while leaving a substantial interior in a larger one. Report the area retained and consider whether the remaining pixels represent the management unit fairly. Compare full-field and interior summaries during method development. A large difference can reveal a boundary or mixture problem that deserves attention before an alert is presented as a crop condition.
Validation should use observations collected at a scale compatible with the satellite interpretation. A measurement from a single plant or a small isolated plot may not describe the larger mixed area observed from orbit. Document the spatial support of both datasets and consider stratified sampling across relevant components. If the application requires information finer than the data can support, seek a suitable complementary source or change the question. Recognising mixed pixels helps an analyst design a credible product instead of assigning field-level precision to an observation that contains several different surfaces.
Deliver quality flags that users can interpret
Quality information should describe the condition of an observation in terms that remain useful through the workflow. A single valid or invalid label may be sufficient for some calculations, but operational users often need to know why an observation was qualified. Distinguish acquisition limitations, processing failures, uncertain reference matches, and conditions that make interpretation ambiguous. These categories point towards different responses and should not be merged without a clear purpose.
Define a small, documented set of flags with stable meanings. Record whether a flag applies to a complete scene, a geographic unit, an individual measurement, or a derived result. A unit containing a mixture of qualified and unqualified observations may also require a coverage measure. Include the rule used to combine flags when summarising data so that a favourable average does not conceal a substantial fraction of unusable input.
Test the flags with the people receiving the product. Ask what they would do differently for each state and whether the terminology supports that choice. Keep the original flags available even if the interface presents a simpler summary. When flag definitions change, version the rules and review their effects on historical comparisons. Useful quality communication makes the condition of the evidence visible at the moment when a user decides how much confidence to place in the result.
Locate the uncertainty that matters to the decision
An uncertainty budget is a practical description of where a result could become unreliable. Begin with the observation chain: acquisition, calibration, geographic matching, reference measurements, feature calculation, modelling, and delivery. Identify the assumptions at each stage and ask which could materially change the interpretation. The purpose is not to assign a precise number to every limitation. It is to locate the sources that deserve attention for the intended decision.
Separate limitations that can be measured from those that currently require a qualitative description. Repeated measurements may help characterise variability, while comparisons with independent references can reveal systematic differences. Some uncertainties interact, so combining individual error estimates without examining their relationships can produce a misleading impression of precision. Keep the method of assessment visible and avoid treating an unexamined assumption as though it were a negligible contribution.
Use the budget to prioritise further work. The largest visible source of variation is not always the one whose reduction would most improve the decision. Consider which additional observation, test, or contextual record would change confidence in an actionable way. Revisit the budget when the application, observation source, or deployment conditions change. This turns uncertainty analysis into a guide for improving the workflow rather than a qualification added only after the result has been delivered.
Bring the evidence back to the decision
The practical outcome should be a short observation plan that another team can follow. It should name the decision, the required evidence, the responsible roles, and the conditions that trigger a field visit or further analysis. Keep the plan small enough to test, then revise it using the results of real inspections. A useful monitoring workflow improves because its assumptions are examined systematically, and its observations remain connected to decisions throughout the process.
Sources & further reading
Explore the bhumisat spacecraft concept and our vision towards 2030, or return to the journal.