A method that produces a plausible result has not automatically demonstrated that it works for its intended users. Validation requires a defined question, suitable reference evidence, and an evaluation design that reflects how the method will be used. This perspective examines which observations should be compared, how they should be sampled, and which errors matter in practice. It also considers the difference between evidence used to develop a method and evidence reserved for evaluating it. The objective is a test that can reveal weaknesses as well as confirm useful performance.
This working guide considers mixed pixels and field boundary effects around aquaculture pond clusters. The immediate decision is to prioritise pond-cluster monitoring visits. Useful reference evidence includes pond boundaries, operation status and timed water measurements. The case is an illustrative planning context, with assumptions to check against the actual sensor, landscape and project requirements.
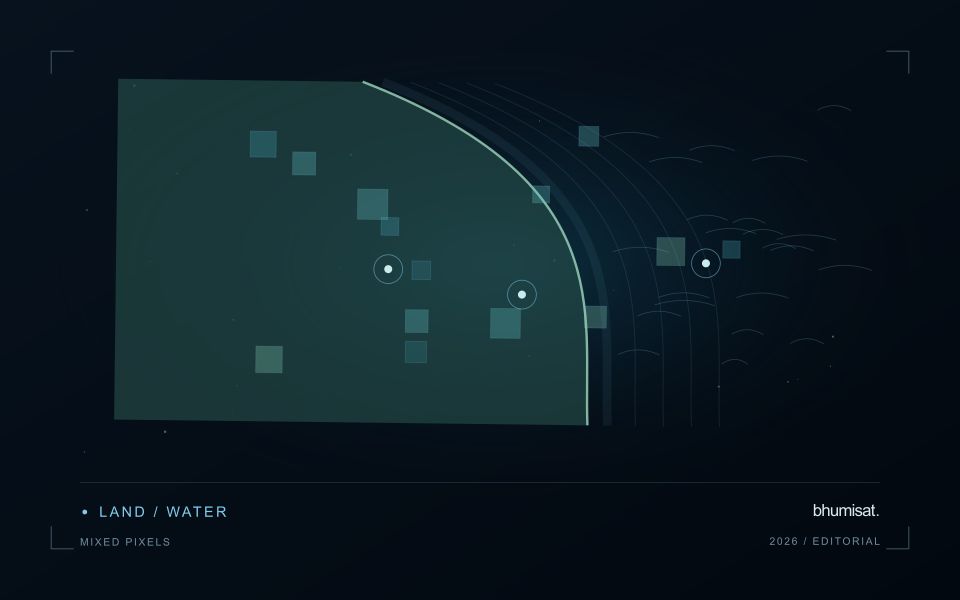
A pixel can represent several surface components
A satellite pixel represents an observation over a ground area, influenced by the instrument's spatial response and the scene within it. That area may contain several materials, such as crop canopy, soil, shade, water or a road. A mixed response is therefore common, especially near boundaries and in fragmented landscapes. It should not be treated automatically as a processing defect. The analytical question is whether the mixture supports the intended interpretation and whether a model trained under one mixture remains applicable under another.
Field geometry affects the number and character of observations available. A compact large field can contain many interior pixels, while a narrow or irregular field may consist mostly of boundary observations. Simply counting pixels does not establish how much independent information a dataset provides. Resampling onto a finer grid also does not remove the original mixing. Before selecting a monitoring product, examine the relationship between field dimensions, relevant landscape features and the measured spatial characteristics of the imagery that will support the service.
Choose a reporting unit that the data can support
Boundary exclusions can help investigate sensitivity to neighbouring surfaces, but they need a consistent rule and a clear purpose. Excluding a fixed distance may remove much of a small field while leaving a substantial interior in a larger one. Report the area retained and consider whether the remaining pixels represent the management unit fairly. Compare full-field and interior summaries during method development. A large difference can reveal a boundary or mixture problem that deserves attention before an alert is presented as a crop condition.
Validation should use observations collected at a scale compatible with the satellite interpretation. A measurement from a single plant or a small isolated plot may not describe the larger mixed area observed from orbit. Document the spatial support of both datasets and consider stratified sampling across relevant components. If the application requires information finer than the data can support, seek a suitable complementary source or change the question. Recognising mixed pixels helps an analyst design a credible product instead of assigning field-level precision to an observation that contains several different surfaces.
The setting: Aquaculture pond clusters
An aquaculture landscape contains ponds at different operating stages together with embankments, channels, roads and service areas. A satellite observation may support a pond inventory or a broader review of visible water patterns, but it should not be assumed to measure conditions within every individual production unit. Begin with boundaries and a record of pond status. Empty, recently filled and active ponds can have different appearances for ordinary operational reasons.
The size of a pond relative to the observation footprint determines how much embankment or neighbouring water contributes to a measurement. Review alignment and exclude unsuitable mixed areas where necessary. Surface reflections, cloud and atmospheric conditions can complicate optical comparison, while short-term management changes may occur between usable acquisitions. Retain observation dates and quality masks so that the image record does not imply continuous knowledge of rapidly changing pond conditions.
Validation should record the unit, collection time, operational context and the measurement method for any water variable being studied. A sample from one pond cannot automatically validate an adjacent pond or an entire cluster. A colour anomaly may help select a monitoring visit without establishing a particular biological condition or production outcome. More specific estimates require a demonstrated relationship with representative measurements, while inventory and inspection-priority products can be evaluated against the practical decisions they support.
Deliver quality flags that users can interpret
Quality information should describe the condition of an observation in terms that remain useful through the workflow. A single valid or invalid label may be sufficient for some calculations, but operational users often need to know why an observation was qualified. Distinguish acquisition limitations, processing failures, uncertain reference matches, and conditions that make interpretation ambiguous. These categories point towards different responses and should not be merged without a clear purpose.
Define a small, documented set of flags with stable meanings. Record whether a flag applies to a complete scene, a geographic unit, an individual measurement, or a derived result. A unit containing a mixture of qualified and unqualified observations may also require a coverage measure. Include the rule used to combine flags when summarising data so that a favourable average does not conceal a substantial fraction of unusable input.
Test the flags with the people receiving the product. Ask what they would do differently for each state and whether the terminology supports that choice. Keep the original flags available even if the interface presents a simpler summary. When flag definitions change, version the rules and review their effects on historical comparisons. Useful quality communication makes the condition of the evidence visible at the moment when a user decides how much confidence to place in the result.
Budget the complete processing workflow
A processing budget should cover the complete path from source observations to a maintained product. Data access and computing are only part of that path. Include preparation, geographic updates, reference collection, expert review, delivery, and support where those activities belong to the service. A calculation that runs cheaply on a small demonstration can still require substantial effort when the surrounding work is repeated across many locations.
Measure representative tasks rather than assuming that every observation costs the same amount to process. Record data volume, processing time, retry frequency, manual interventions, and the conditions that create unusually demanding cases. Separate fixed setup work from work that grows with the number of observations or users. These records support decisions about batching, caching, storage policy, and the point at which a different processing design becomes worthwhile.
Connect the budget to a defined level of service. Faster delivery, more frequent observation, broader coverage, or more detailed review can each change the resources required. Describe these trade-offs before promising a delivery pattern that the workflow has not demonstrated. Review the budget using operational evidence and preserve enough detail to understand changes between processing versions. The aim is a sustainable service whose resource choices remain aligned with the information that users value.
Bring the evidence back to the decision
The validation record should explain the population represented by the test, the reference observations used, and the limitations of the comparison. Report meaningful errors alongside useful successes, and retain examples that challenge the method. Treat wider deployment as a new opportunity to evaluate transfer across relevant conditions. A well-designed validation programme gives users a defensible basis for deciding where the method is useful, where additional evidence is needed, and where another approach may be appropriate.
Sources & further reading
Explore the bhumisat spacecraft concept and our vision towards 2030, or return to the journal.