Remote observations show patterns, while practical decisions depend on explaining what those patterns could mean. Interpretation therefore requires more than locating a high or low value on a map. A useful analysis considers the timing of the observation, the physical processes that influence the measurement, and the information available from complementary sources. This perspective separates an observed signal from a proposed explanation and from an action recommended to a user. Keeping those stages distinct makes it easier to investigate alternative causes, communicate ambiguity, and choose a proportionate next step.
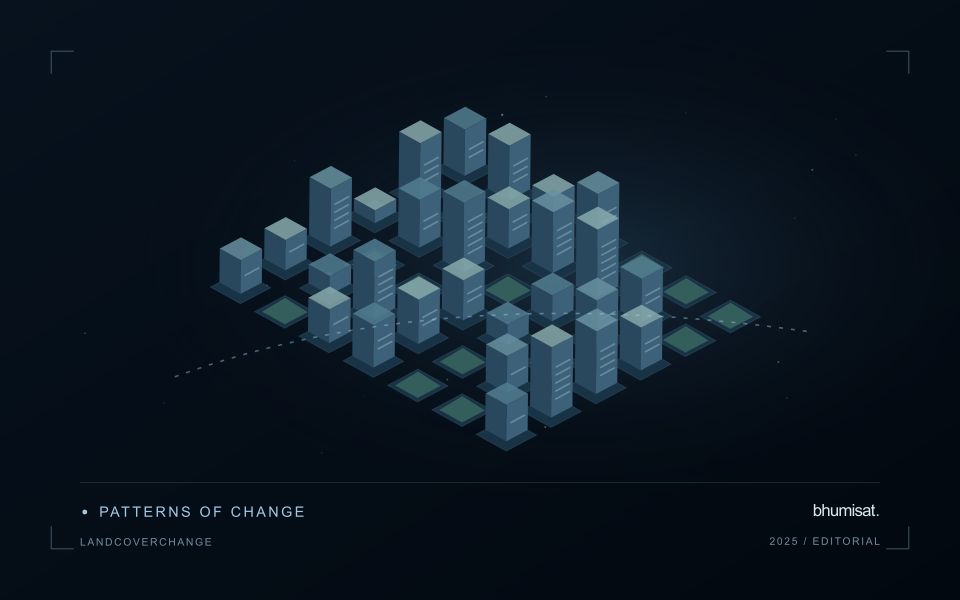
This working guide considers detecting persistent land cover change around active construction sites. The immediate decision is to prioritise sites requiring progress review. Useful reference evidence includes dated site records and consistently located surface observations. The case is an illustrative planning context, with assumptions to check against the actual sensor, landscape and project requirements.
The setting: Construction site change
A construction site can progress through clearing, ground works, temporary storage, structural development and surface finishing. A satellite image may reveal some visible changes without establishing whether the project has reached a contractual or operational milestone. Define the monitoring objective in terms of observable surfaces and the decisions the information should support. Site boundaries and a reliable sequence of dated records provide the context needed to distinguish project activity from changes in neighbouring land.
The size and arrangement of features determine what the image can resolve. Stockpiles, temporary access routes and partly completed structures may be mixed with other surfaces within an observation. Shadows and acquisition geometry can also change the appearance of buildings. Compare quality-screened observations and retain the dates supporting each mapped change. A map should not imply that every visible feature was measured independently or that its physical dimensions are known more precisely than the data allow.
Validation should use dated site observations that describe the same area and feature definition as the analysis. Record temporary works and other context that might explain an apparent change. A remote observation can help select a site for review, while more specific statements about project progress need relevant project records. Evaluate whether the product provides useful and timely evidence for that review, including examples where a conspicuous image change had an ordinary or temporary explanation.
Define a transition that matters
Land cover change analysis asks whether the physical surface changed between observations. Land use describes how people manage or use that surface, which may require contextual evidence beyond imagery. Define the classes, transition rules, reporting period, and minimum mapping unit before selecting a method. A forest to built surface transition differs from temporary bare soil within a cropping cycle. The definition should state how mixed pixels, gradual changes, and temporary disturbances are represented so that a map reader can interpret the result consistently.
Two classified images can be compared to describe transitions, but errors in either classification enter the change map. Direct spectral change methods can detect altered reflectance without assigning a reliable cause. Time series methods add evidence about timing and persistence, helping separate an abrupt disturbance from seasonal vegetation cycles. They still depend on the density and quality of observations. A long cloud gap can hide the true change date, and sensor or processing differences can create breaks unrelated to the ground.
Control differences before counting change
Use a common grid and check alignment at stable features. Small positional shifts can generate false change along rivers, field boundaries, and roads. Harmonize comparable measurements, apply quality masks, and examine seasonal differences in illumination, rainfall, crop development, and water levels. Record valid observation counts rather than treating cloudy pixels as stable land. If using annual composites, explain whether they represent a season, a statistical summary, or a selected observation, because each choice changes the temporal meaning of a transition.
Design reference sampling to include both changed and unchanged locations, with enough examples of uncommon transitions. Inspect independent evidence across dates and record uncertainty in reference labels when the transition is ambiguous. Report errors for individual transitions rather than only overall map accuracy, since extensive stable areas can make weak change detection look successful. Estimate transition areas with the sampling design and appropriate uncertainty, especially when the mapped change class has false positives. Preserve class definitions and processing versions when comparing periods. A defensible summary states what changed, the interval during which it was observed, and how reliably the analysis distinguishes it from observation artifacts and temporary surface conditions.
Match the timing of reference observations
The value of a reference measurement depends partly on how well its timing matches the observation being evaluated. A surface, crop, water body, or instrument state may change between the two measurements. Start by documenting the acquisition time of every source and the period over which the reference observation applies. Avoid treating a date entered during data upload as though it were necessarily the time when the measurement was collected.
Define an acceptable timing relationship for the application. A slowly changing structural feature may tolerate a broader comparison window than a rapidly changing surface condition. The window should be justified by the process being studied and by any available contextual records. If conditions change within that period, consider separating the observations into suitable groups rather than combining them under a single assumption of comparability.
Preserve information about interventions and events between observations. A management operation, rainfall episode, disturbance, or change in sensor configuration can alter the interpretation of a comparison. Record the event and decide whether the pair remains suitable for evaluation. Where the timing mismatch cannot be resolved, describe the comparison as qualified evidence. This is more informative than allowing an uncertain match to influence a performance statistic without explanation.
Check spatial alignment before comparison
A comparison between images, channels, maps, or field measurements assumes that the observations refer to the same locations at a suitable level of precision. Small alignment errors can become especially important near boundaries or narrow features. Before interpreting differences, inspect whether identifiable, stable features agree between the sources. A common coordinate reference is necessary for many workflows, but it does not by itself demonstrate accurate alignment.
Use control features that are appropriate for the observation scale and remain stable across the comparison period. Evaluate alignment in more than one part of the area, because a single location cannot reveal spatially varying distortion. Record the method used to estimate any correction and retain independent features for checking the corrected result. Where surfaces have genuinely changed, avoid using those changes as evidence of an alignment error.
Propagate the implications of remaining misalignment into the analysis. A workflow may exclude boundary pixels, summarise at a broader scale, or qualify interpretations for small features. The choice should follow the application rather than a preference for visually smooth output. Preserve both the original and corrected geographic references, and document resampling decisions so that future users can understand how measurements were moved onto a common spatial framework.
Bring the evidence back to the decision
A strong interpretation states what was observed, which explanations remain plausible, and what additional evidence would help distinguish them. Avoid presenting a convenient label as a confirmed cause when the measurements support only a broader pattern. Connect the proposed next step to the significance of the decision and the confidence available. This creates an interpretation that a field team, analyst, or project partner can examine, challenge, and improve as further observations become available.
Sources & further reading
Explore the bhumisat spacecraft concept and our vision towards 2030, or return to the journal.