Remote observations show patterns, while practical decisions depend on explaining what those patterns could mean. Interpretation therefore requires more than locating a high or low value on a map. A useful analysis considers the timing of the observation, the physical processes that influence the measurement, and the information available from complementary sources. This perspective separates an observed signal from a proposed explanation and from an action recommended to a user. Keeping those stages distinct makes it easier to investigate alternative causes, communicate ambiguity, and choose a proportionate next step.
This working guide considers harmonising satellite observation time series during payload integration studies. The immediate decision is to plan integrated payload test sequences. Useful reference evidence includes measured instrument responses and traceable test configurations. The case is an illustrative planning context, with assumptions to check against the actual sensor, landscape and project requirements.
The setting: Payload integration studies
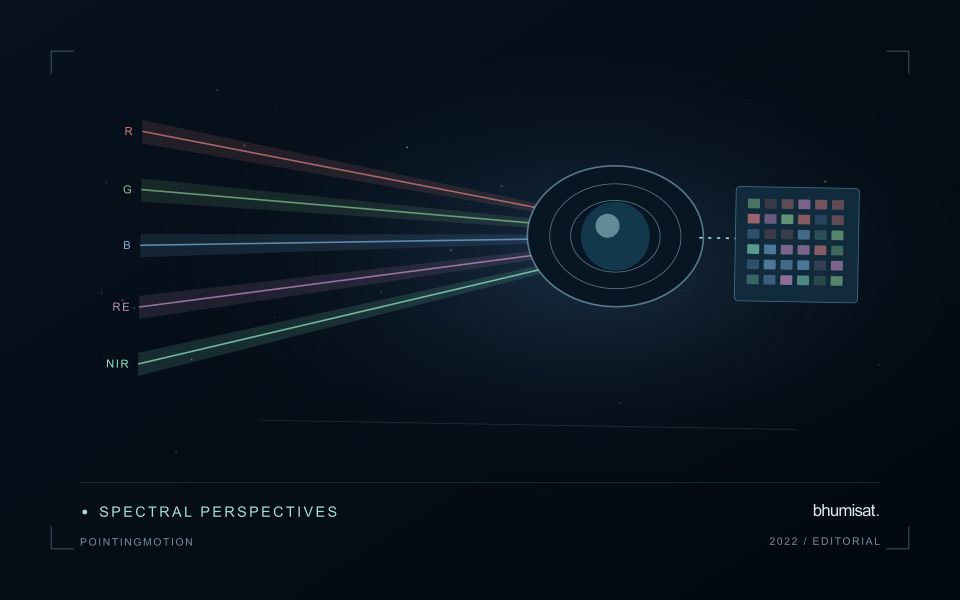
A payload integration study examines how an observation instrument behaves as part of a wider spacecraft concept. The camera, optics, electronics, structure and processing path cannot be assessed solely as independent catalogue items. Begin by identifying the measurements the complete system must support and the conditions under which they should be demonstrated. A component description can inform the design, but it does not establish the performance of an integrated imaging chain.
Test planning should record the hardware configuration, operating settings, reference targets and environmental conditions relevant to each measurement. Changes between tests need to remain traceable so that an apparent improvement is not confused with a different test setup. Spectral alignment, image geometry and radiometric consistency may interact with mechanical or thermal behaviour. The investigation should identify those relationships rather than relying only on whether an acquired test image looks visually sharp or colourful.
Acceptance criteria should connect instrument measurements with the needs of the intended application. Retain uncertainties, unsuccessful tests and design changes as part of the evidence used to evaluate progress. A laboratory demonstration under one condition should not be described as flight-qualified capability without the necessary additional work. A useful result at this stage is an auditable account of integrated behaviour, the remaining measurement questions and the next tests needed to assess the proposed payload architecture.
More observations require a common measurement definition
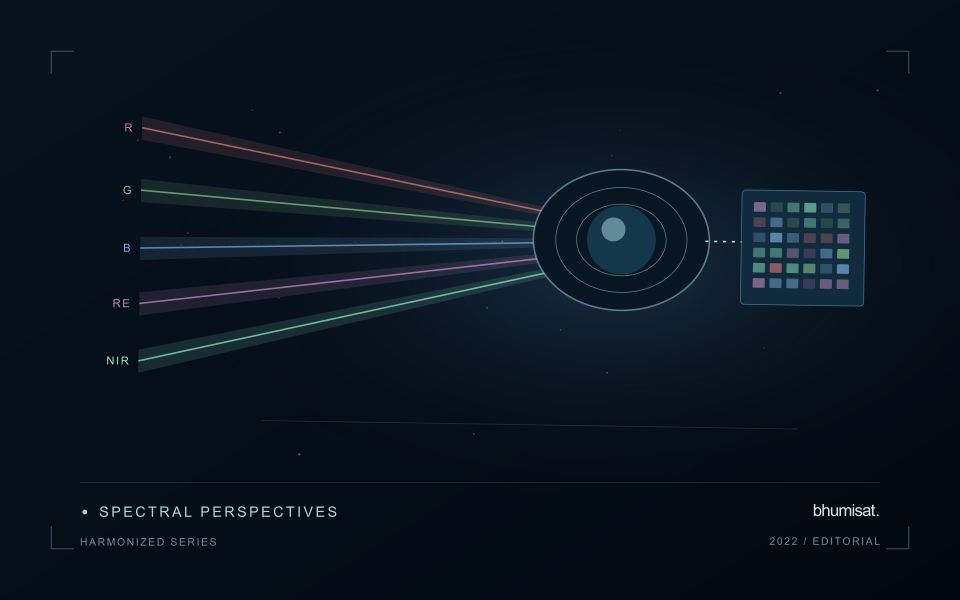
Combining observations from different satellites can increase the information available through time, but the resulting series needs a common analytical definition. Instruments may differ in spectral response, spatial sampling, viewing geometry and processing history. Two bands with similar names are not necessarily equivalent measurements. Harmonisation addresses selected differences so that observations can be used together more consistently. It should be understood as a documented processing approach with remaining limitations, rather than a guarantee that every value from every sensor is interchangeable.
A suitable workflow begins with the variables that need to be compared. Identify the input products, their physical meaning and the transformations already applied. A common grid helps organise observations spatially, while atmospheric correction, geometry normalisation and spectral adjustments may address other differences. These operations have distinct purposes. Applying only one of them should not be described as complete harmonisation. Retain sensor identity and acquisition metadata even when the user sees one combined series, because those attributes remain valuable for diagnosing an apparent discontinuity.
Validate continuity before interpreting a longer record
Test continuity using overlapping or otherwise comparable observations and independent evidence where available. Inspect several surface types and canopy conditions rather than evaluating only one convenient landscape. A consistent average relationship can still hide a meaningful difference for a particular crop or season. Examine how the combined record affects the final product, including index thresholds, fitted timing metrics and change alerts. The relevant question is whether the remaining differences are acceptable for that application, not merely whether the images appear similar on a map.
A longer record also requires a stable policy for quality screening and updates. Changes in input collections, calibration or processing versions can affect historical outputs. Version the workflow and preserve enough information to reproduce earlier results when necessary. When a series crosses a known processing change, evaluate the transition explicitly. A harmonised dataset can provide a strong foundation for monitoring, but field context and validation still determine the usefulness of its interpretation. Maintaining traceability allows additional observations to improve coverage without concealing their origins or implying a precision that has not been demonstrated.
Match the timing of reference observations
The value of a reference measurement depends partly on how well its timing matches the observation being evaluated. A surface, crop, water body, or instrument state may change between the two measurements. Start by documenting the acquisition time of every source and the period over which the reference observation applies. Avoid treating a date entered during data upload as though it were necessarily the time when the measurement was collected.
Define an acceptable timing relationship for the application. A slowly changing structural feature may tolerate a broader comparison window than a rapidly changing surface condition. The window should be justified by the process being studied and by any available contextual records. If conditions change within that period, consider separating the observations into suitable groups rather than combining them under a single assumption of comparability.
Preserve information about interventions and events between observations. A management operation, rainfall episode, disturbance, or change in sensor configuration can alter the interpretation of a comparison. Record the event and decide whether the pair remains suitable for evaluation. Where the timing mismatch cannot be resolved, describe the comparison as qualified evidence. This is more informative than allowing an uncertain match to influence a performance statistic without explanation.
Represent gaps without inventing observations
A monitoring sequence often contains periods without a usable observation. The reason may be cloud, shadow, missing coverage, a failed transfer, or a quality condition that excludes the data. Begin by representing these states explicitly. A missing observation is different from a low measurement, an unchanged surface, or a confirmed absence of the feature being studied. The distinction should survive both the analysis and the presentation of the result.
Define when a temporal gap is acceptable for the intended decision. A workflow may continue using the latest qualified observation, request another source, or suspend an alert until sufficient evidence is available. Whichever response is selected, show the age of the supporting observation. If interpolation is used for a suitable analytical purpose, preserve the distinction between an estimated value and a directly observed measurement, together with the assumptions needed to interpret it.
Review how gaps affect the coverage of the final evaluation. Locations with frequent missing data may differ systematically from those with regular observations. A performance estimate based only on clear, complete records can therefore describe a narrower population than the service is expected to support. Report usable coverage alongside analytical results and use recurring gaps to guide acquisition planning, reference collection, and the selection of complementary observation methods.
Bring the evidence back to the decision
A strong interpretation states what was observed, which explanations remain plausible, and what additional evidence would help distinguish them. Avoid presenting a convenient label as a confirmed cause when the measurements support only a broader pattern. Connect the proposed next step to the significance of the decision and the confidence available. This creates an interpretation that a field team, analyst, or project partner can examine, challenge, and improve as further observations become available.
Sources & further reading
Explore the bhumisat spacecraft concept and our vision towards 2030, or return to the journal.