A convincing image can still contain measurements that are unsuitable for a particular task. Quality control asks whether the inputs, transformations, and outputs meet the requirements of the intended application. This perspective follows evidence through the workflow, from acquisition metadata and reference observations to the final interpretation. It encourages teams to define acceptance conditions before seeing the result, rather than adjusting them to favour a preferred conclusion. The purpose is a repeatable way to distinguish usable observations, observations requiring qualification, and observations that should be excluded from a decision.
This working guide considers harmonising satellite observation time series across managed grazing pastures. The immediate decision is to schedule paddock condition inspections. Useful reference evidence includes grazing history, vegetation cover and field biomass samples. The case is an illustrative planning context, with assumptions to check against the actual sensor, landscape and project requirements.
More observations require a common measurement definition
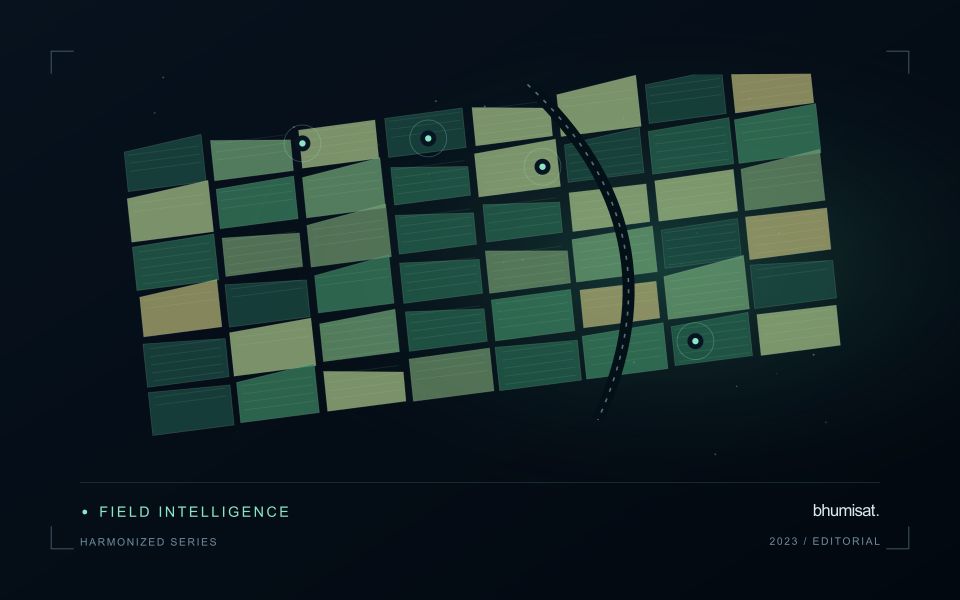
Combining observations from different satellites can increase the information available through time, but the resulting series needs a common analytical definition. Instruments may differ in spectral response, spatial sampling, viewing geometry and processing history. Two bands with similar names are not necessarily equivalent measurements. Harmonisation addresses selected differences so that observations can be used together more consistently. It should be understood as a documented processing approach with remaining limitations, rather than a guarantee that every value from every sensor is interchangeable.
A suitable workflow begins with the variables that need to be compared. Identify the input products, their physical meaning and the transformations already applied. A common grid helps organise observations spatially, while atmospheric correction, geometry normalisation and spectral adjustments may address other differences. These operations have distinct purposes. Applying only one of them should not be described as complete harmonisation. Retain sensor identity and acquisition metadata even when the user sees one combined series, because those attributes remain valuable for diagnosing an apparent discontinuity.
Validate continuity before interpreting a longer record
Test continuity using overlapping or otherwise comparable observations and independent evidence where available. Inspect several surface types and canopy conditions rather than evaluating only one convenient landscape. A consistent average relationship can still hide a meaningful difference for a particular crop or season. Examine how the combined record affects the final product, including index thresholds, fitted timing metrics and change alerts. The relevant question is whether the remaining differences are acceptable for that application, not merely whether the images appear similar on a map.
A longer record also requires a stable policy for quality screening and updates. Changes in input collections, calibration or processing versions can affect historical outputs. Version the workflow and preserve enough information to reproduce earlier results when necessary. When a series crosses a known processing change, evaluate the transition explicitly. A harmonised dataset can provide a strong foundation for monitoring, but field context and validation still determine the usefulness of its interpretation. Maintaining traceability allows additional observations to improve coverage without concealing their origins or implying a precision that has not been demonstrated.
The setting: Managed grazing pastures
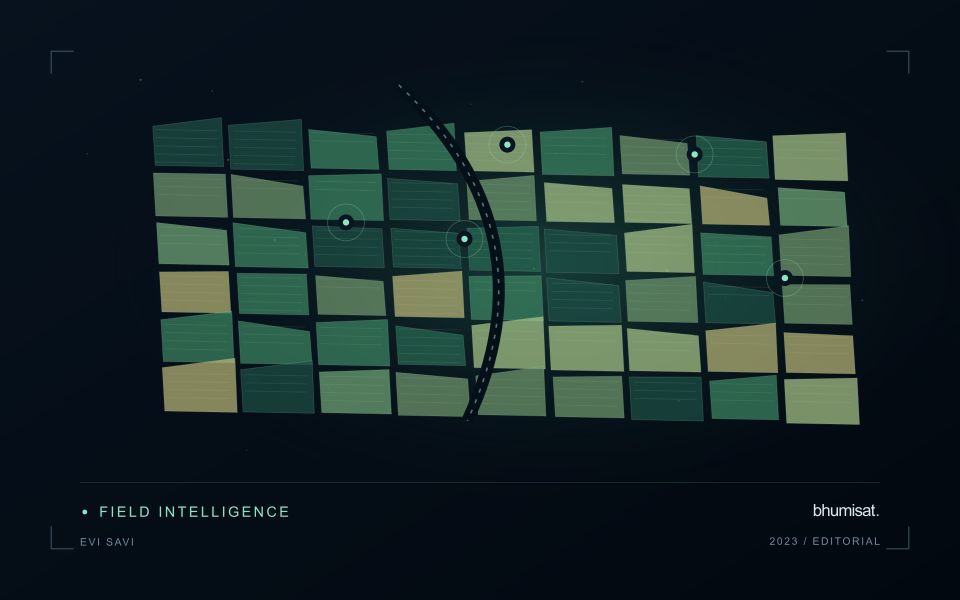
A managed pasture changes with grazing, recovery, mowing, rainfall and the mixture of vegetation present. A recently grazed paddock may show a lower vegetation response than a rested paddock without indicating a management failure. Interpret the image sequence with the paddock calendar and the intended operational question. The relevant product could describe vegetation cover, compare recovery patterns or help select locations for a field assessment of forage availability.
Paddock boundaries should separate the vegetation of interest from tracks, water points, tree cover and other surfaces where possible. These features can occupy a meaningful portion of small units. Repeated observations need quality screening and an explicit treatment of periods without suitable imagery. A green appearance alone does not establish forage quality, accessible biomass or the amount animals can use, so avoid substituting an index map for the measurements needed by a grazing decision.
Field validation should record recent grazing and management together with vegetation condition at known sampling locations. If biomass is estimated, use representative field samples with a clearly defined measurement method and spatial support. Include different recovery stages and ordinary paddock conditions in evaluation rather than only the most obvious extremes. A practical reporting system connects each mapped pattern to its observation date, management context and the field checks needed before changing an operational plan.
Define a representative reference sample
A reference sample should represent the situations in which a method will be used. Begin by defining the target population: locations, time periods, management conditions, surface types, or instrument states that belong within the intended application. A collection of convenient observations may be valuable for exploration, but it does not automatically support conclusions about that wider population. Make the scope of the sample visible before calculating a summary of performance.
Consider a stratified design when important conditions are unevenly represented. Relevant strata might include different landscape types, developmental stages, observation quality levels, or ranges of the variable being estimated. Choose sample locations within those groups using a documented rule, and retain the information needed to understand their selection. Where access restrictions affect the sample, record the excluded conditions so that the limits of the resulting evaluation remain clear.
Keep development and evaluation evidence separate where the purpose of the study requires an independent test. Nearby observations or repeated measurements can share information, so a random split of individual records may overstate independence. A split organised by location, period, or operational unit can provide a more demanding comparison. The appropriate design follows the intended deployment, the structure of the observations, and the errors that matter to the user.
Organise imagery and results for reliable retrieval
A useful storage design helps people and software find the right observation without relying on informal knowledge of folder names. Separate immutable source data from temporary processing files and delivered products. Give each observation a stable identifier and preserve its acquisition metadata alongside the file. A predictable organisation reduces the chance that a later analysis accidentally uses a preview, an outdated result, or an intermediate product whose meaning has not been documented.
Choose an indexing scheme that reflects the questions the workflow needs to answer. Location, acquisition time, source, product type, and processing version are often useful search dimensions. The physical arrangement of files can differ from the logical catalogue, provided that the relationship is maintained reliably. Record checksums or other integrity information where appropriate, and test whether an observation can be recovered using the catalogue rather than a particular operator's memory.
Define retention rules for source, intermediate, and delivered information. Some intermediate products are inexpensive to reproduce, while others embody costly preparation or expert review. Keep the inputs and configuration needed to rebuild a result before removing reproducible files. Test backup and recovery procedures with representative products, including their metadata and geographic references. Reliable retrieval is demonstrated by a successful reconstruction of useful information, rather than by the existence of an untested copy.
Bring the evidence back to the decision
Quality control is most useful when its results travel with the information being delivered. Preserve the reasons for accepting or rejecting an observation, and expose limitations that could change the user's interpretation. Review recurring failures as clues about the design of the workflow. A clear quality record supports consistent comparisons between operators and processing versions, while helping the team decide whether a problem originates in acquisition, preparation, interpretation, or the underlying observation requirements.
Sources & further reading
Explore the bhumisat spacecraft concept and our vision towards 2030, or return to the journal.