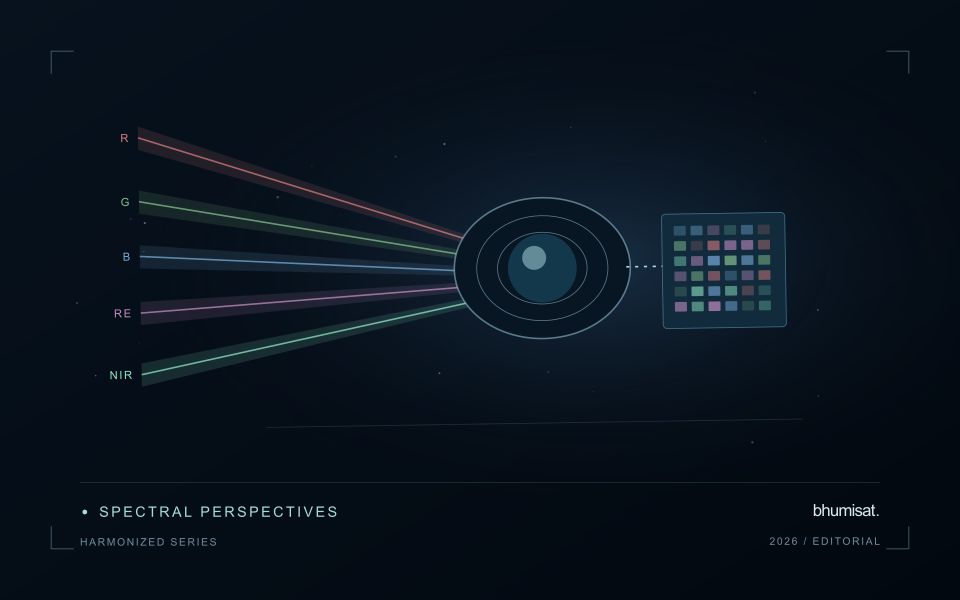
An analytical result becomes operational information only when the receiving team can understand it and use it within existing responsibilities. Handoffs often fail because assumptions that were obvious to the analyst are absent from the delivered product. This perspective considers the information needed at that boundary: acquisition time, processing status, geographic scope, quality qualifications, and the action expected from the recipient. It also asks how corrections and feedback should return to the producing team. A dependable handoff creates a shared understanding of the result, rather than merely transferring a file.
This working guide considers harmonising satellite observation time series at calibration reference sites. The immediate decision is to select repeatable calibration observations. Useful reference evidence includes target properties, measurement conditions and acquisition geometry. The case is an illustrative planning context, with assumptions to check against the actual sensor, landscape and project requirements.
More observations require a common measurement definition
Combining observations from different satellites can increase the information available through time, but the resulting series needs a common analytical definition. Instruments may differ in spectral response, spatial sampling, viewing geometry and processing history. Two bands with similar names are not necessarily equivalent measurements. Harmonisation addresses selected differences so that observations can be used together more consistently. It should be understood as a documented processing approach with remaining limitations, rather than a guarantee that every value from every sensor is interchangeable.
A suitable workflow begins with the variables that need to be compared. Identify the input products, their physical meaning and the transformations already applied. A common grid helps organise observations spatially, while atmospheric correction, geometry normalisation and spectral adjustments may address other differences. These operations have distinct purposes. Applying only one of them should not be described as complete harmonisation. Retain sensor identity and acquisition metadata even when the user sees one combined series, because those attributes remain valuable for diagnosing an apparent discontinuity.
Validate continuity before interpreting a longer record
Test continuity using overlapping or otherwise comparable observations and independent evidence where available. Inspect several surface types and canopy conditions rather than evaluating only one convenient landscape. A consistent average relationship can still hide a meaningful difference for a particular crop or season. Examine how the combined record affects the final product, including index thresholds, fitted timing metrics and change alerts. The relevant question is whether the remaining differences are acceptable for that application, not merely whether the images appear similar on a map.
A longer record also requires a stable policy for quality screening and updates. Changes in input collections, calibration or processing versions can affect historical outputs. Version the workflow and preserve enough information to reproduce earlier results when necessary. When a series crosses a known processing change, evaluate the transition explicitly. A harmonised dataset can provide a strong foundation for monitoring, but field context and validation still determine the usefulness of its interpretation. Maintaining traceability allows additional observations to improve coverage without concealing their origins or implying a precision that has not been demonstrated.
The setting: Calibration reference sites
A calibration reference site is useful when its properties and observation conditions are understood well enough for a defined comparison. The relevant target depends on the instrument and measurement being evaluated. A site chosen for geometric checks may not provide the evidence needed for a radiometric assessment. Define the quantity being tested, the spatial area represented and the expected sources of variation before treating a convenient surface as a reliable reference.
Repeatable measurements require more than returning to the same coordinates. Illumination, atmosphere, surface condition, viewing geometry and the instrument operating state can all influence the result. Record the factors that matter to the chosen test and identify circumstances that make an observation unsuitable. The target should occupy an appropriate fraction of the measurement footprint, with enough surrounding context to assess mixing, alignment and other effects relevant to the comparison.
The evaluation should preserve measurement uncertainty and distinguish calibration evidence from an application demonstration. A successful comparison at one reference site does not establish performance under every mission condition. Repeat observations, independent checks and clear acceptance criteria strengthen the interpretation. The practical output is a traceable record of what was measured, under which conditions and against which reference, so that a later processing or hardware change can be assessed using a consistent and defensible basis.
Represent gaps without inventing observations
A monitoring sequence often contains periods without a usable observation. The reason may be cloud, shadow, missing coverage, a failed transfer, or a quality condition that excludes the data. Begin by representing these states explicitly. A missing observation is different from a low measurement, an unchanged surface, or a confirmed absence of the feature being studied. The distinction should survive both the analysis and the presentation of the result.
Define when a temporal gap is acceptable for the intended decision. A workflow may continue using the latest qualified observation, request another source, or suspend an alert until sufficient evidence is available. Whichever response is selected, show the age of the supporting observation. If interpolation is used for a suitable analytical purpose, preserve the distinction between an estimated value and a directly observed measurement, together with the assumptions needed to interpret it.
Review how gaps affect the coverage of the final evaluation. Locations with frequent missing data may differ systematically from those with regular observations. A performance estimate based only on clear, complete records can therefore describe a narrower population than the service is expected to support. Report usable coverage alongside analytical results and use recurring gaps to guide acquisition planning, reference collection, and the selection of complementary observation methods.
Locate the uncertainty that matters to the decision
An uncertainty budget is a practical description of where a result could become unreliable. Begin with the observation chain: acquisition, calibration, geographic matching, reference measurements, feature calculation, modelling, and delivery. Identify the assumptions at each stage and ask which could materially change the interpretation. The purpose is not to assign a precise number to every limitation. It is to locate the sources that deserve attention for the intended decision.
Separate limitations that can be measured from those that currently require a qualitative description. Repeated measurements may help characterise variability, while comparisons with independent references can reveal systematic differences. Some uncertainties interact, so combining individual error estimates without examining their relationships can produce a misleading impression of precision. Keep the method of assessment visible and avoid treating an unexamined assumption as though it were a negligible contribution.
Use the budget to prioritise further work. The largest visible source of variation is not always the one whose reduction would most improve the decision. Consider which additional observation, test, or contextual record would change confidence in an actionable way. Revisit the budget when the application, observation source, or deployment conditions change. This turns uncertainty analysis into a guide for improving the workflow rather than a qualification added only after the result has been delivered.
Bring the evidence back to the decision
A successful handoff leaves the recipient with a clear result, sufficient context, and a practical route for raising questions. Test the delivery with the people who will use it, including how they respond when observations are missing or qualified. Capture their feedback as evidence for improving the product. The most useful delivery format is the one that preserves the relevant technical meaning while fitting the decisions, time constraints, and responsibilities of its intended audience.
Sources & further reading
Explore the bhumisat spacecraft concept and our vision towards 2030, or return to the journal.