Every observation and interpretation contains uncertainty, but the sources and consequences of that uncertainty differ between applications. Some arise from acquisition conditions, others from reference measurements, processing choices, or the transfer of a model to a new setting. This perspective examines how those sources affect the decision a user is considering. It encourages teams to describe uncertainty in a form that can influence action, rather than adding a generic qualification at the end of a report. The objective is to support proportionate decisions while keeping the limits of the available evidence understandable.
This working guide considers harmonising satellite observation time series in apple orchard management. The immediate decision is to review orchard blocks by growth stage. Useful reference evidence includes pruning history, phenological stage and representative canopy notes. The case is an illustrative planning context, with assumptions to check against the actual sensor, landscape and project requirements.
More observations require a common measurement definition
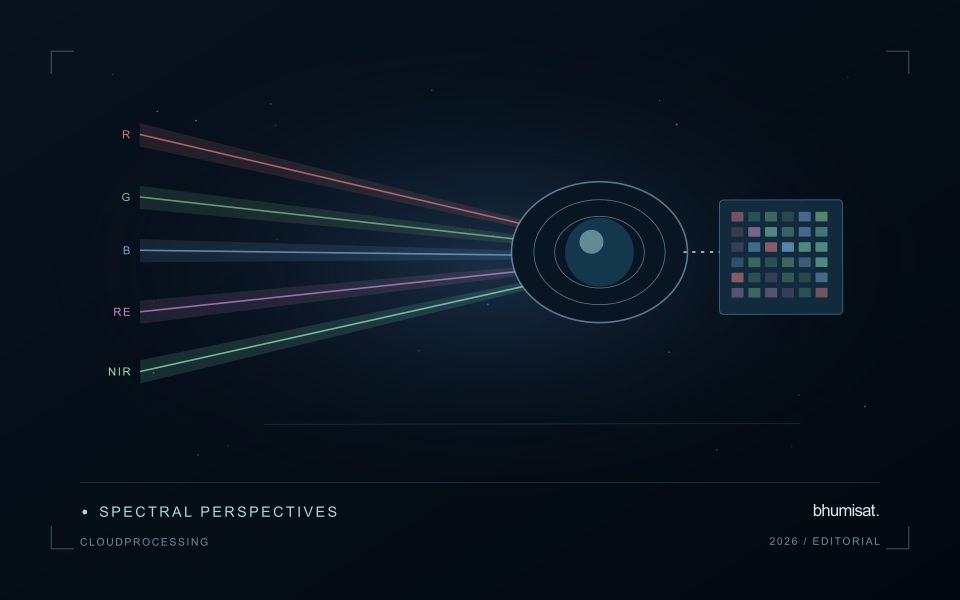
Combining observations from different satellites can increase the information available through time, but the resulting series needs a common analytical definition. Instruments may differ in spectral response, spatial sampling, viewing geometry and processing history. Two bands with similar names are not necessarily equivalent measurements. Harmonisation addresses selected differences so that observations can be used together more consistently. It should be understood as a documented processing approach with remaining limitations, rather than a guarantee that every value from every sensor is interchangeable.
A suitable workflow begins with the variables that need to be compared. Identify the input products, their physical meaning and the transformations already applied. A common grid helps organise observations spatially, while atmospheric correction, geometry normalisation and spectral adjustments may address other differences. These operations have distinct purposes. Applying only one of them should not be described as complete harmonisation. Retain sensor identity and acquisition metadata even when the user sees one combined series, because those attributes remain valuable for diagnosing an apparent discontinuity.
Validate continuity before interpreting a longer record
Test continuity using overlapping or otherwise comparable observations and independent evidence where available. Inspect several surface types and canopy conditions rather than evaluating only one convenient landscape. A consistent average relationship can still hide a meaningful difference for a particular crop or season. Examine how the combined record affects the final product, including index thresholds, fitted timing metrics and change alerts. The relevant question is whether the remaining differences are acceptable for that application, not merely whether the images appear similar on a map.
A longer record also requires a stable policy for quality screening and updates. Changes in input collections, calibration or processing versions can affect historical outputs. Version the workflow and preserve enough information to reproduce earlier results when necessary. When a series crosses a known processing change, evaluate the transition explicitly. A harmonised dataset can provide a strong foundation for monitoring, but field context and validation still determine the usefulness of its interpretation. Maintaining traceability allows additional observations to improve coverage without concealing their origins or implying a precision that has not been demonstrated.
The setting: Apple orchard management
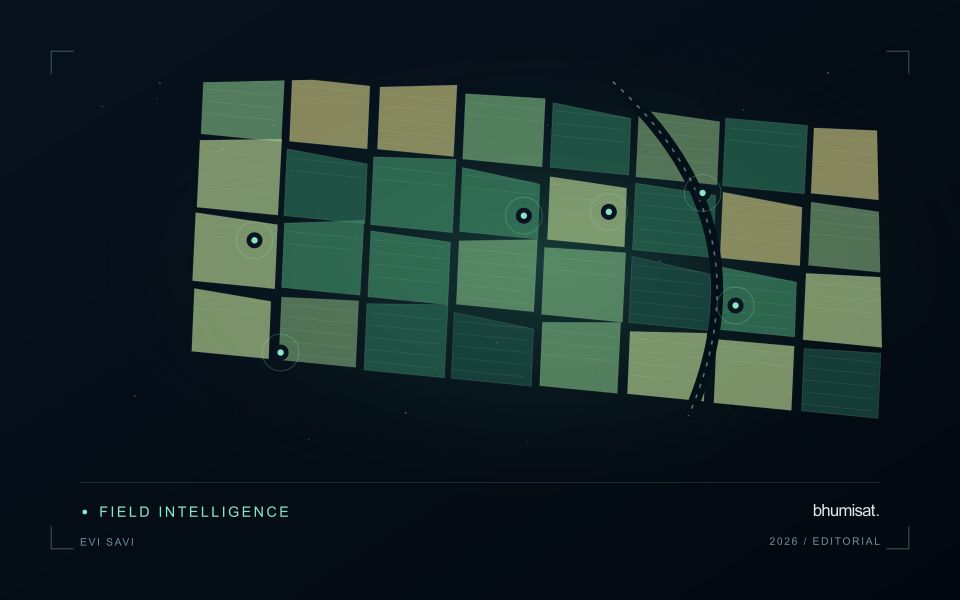
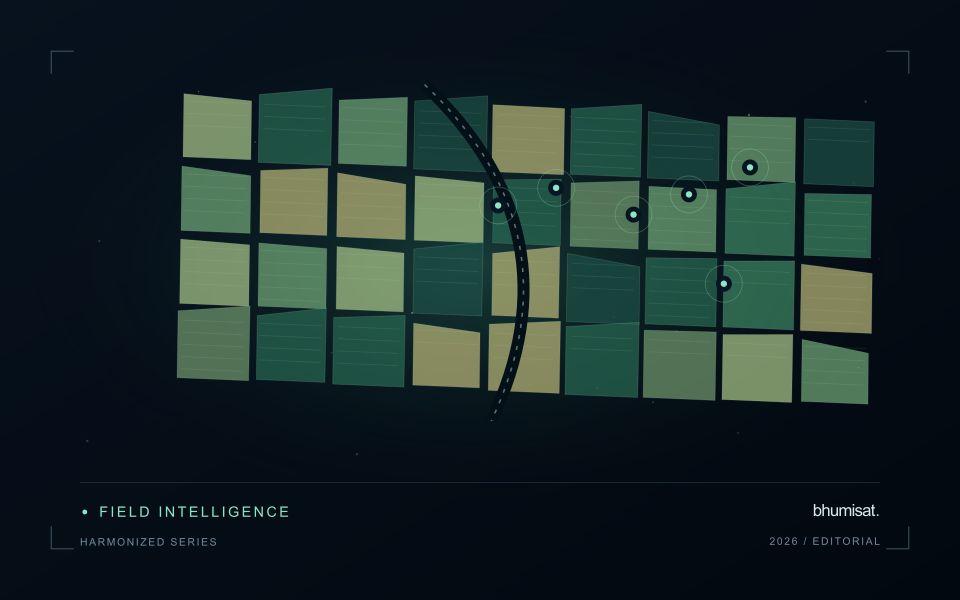
Apple orchards follow a strong management and seasonal sequence, and the surface seen by a satellite changes with it. Leaf development, pruning, ground cover and harvest-related activity can alter the observation without indicating an unexpected problem. A monitoring design should identify which part of this sequence matters to the decision. Store block boundaries together with tree age, training arrangement and a record of the events that could influence a comparison between dates.
Canopy measurements and block measurements are not always the same thing. Where the image resolution mixes tree rows with soil or grass, the resulting value describes that mixture. Differences in row direction and illumination can further complicate interpretation. Use imagery at a suitable spatial support and retain the valid observation area within each summary. A more detailed map should be justified by the information actually resolved, rather than by the sharpness of its display.
Field validation should record phenological stage, canopy condition and recent management at identified sample locations. If the intended service concerns fruit production or quality, it requires corresponding measurements and an evaluation plan matched to that outcome. A canopy anomaly may help focus inspection but does not establish its cause. Reports should give orchard staff the dates, quality context and operational interpretation needed to judge whether another field visit would improve a pending decision.
Design field observations around the information need
Field observations are most useful when they answer a defined question within the monitoring workflow. Begin by identifying the variable, condition, or management event that needs to be recorded and the geographic unit to which it applies. Distinguish direct measurements from an observer's interpretation. A consistent record of crop stage, management timing, and visible conditions can provide valuable context even when the field team is not collecting a complex set of measurements.
Prepare a collection protocol that reflects the variability of the site. Define where observations are made within a unit, how many locations are represented, and how the position and time are recorded. Avoid selecting only the most dramatic or convenient examples. Include apparently normal conditions and records that might challenge the remote interpretation. Where a measurement method has known limitations, preserve the information needed to assess whether those limitations affect the intended comparison.
Link field records to the corresponding remote observations without losing their original detail. Geographic matching, timing, and the scale represented by each record should remain visible. Review disagreements with the collecting team before changing a label or excluding an observation. A disagreement may reveal a timing mismatch, a mixed surface, or an incomplete interpretation rather than a simple error. The field programme should improve the understanding of the monitoring process as well as provide evidence for evaluating its outputs.
Represent gaps without inventing observations
A monitoring sequence often contains periods without a usable observation. The reason may be cloud, shadow, missing coverage, a failed transfer, or a quality condition that excludes the data. Begin by representing these states explicitly. A missing observation is different from a low measurement, an unchanged surface, or a confirmed absence of the feature being studied. The distinction should survive both the analysis and the presentation of the result.
Define when a temporal gap is acceptable for the intended decision. A workflow may continue using the latest qualified observation, request another source, or suspend an alert until sufficient evidence is available. Whichever response is selected, show the age of the supporting observation. If interpolation is used for a suitable analytical purpose, preserve the distinction between an estimated value and a directly observed measurement, together with the assumptions needed to interpret it.
Review how gaps affect the coverage of the final evaluation. Locations with frequent missing data may differ systematically from those with regular observations. A performance estimate based only on clear, complete records can therefore describe a narrower population than the service is expected to support. Report usable coverage alongside analytical results and use recurring gaps to guide acquisition planning, reference collection, and the selection of complementary observation methods.
Bring the evidence back to the decision
Useful uncertainty communication identifies the limitation, explains how it could affect the result, and connects it to a practical response. Some decisions can proceed with a qualified estimate; others require another observation or an independent check. Preserve uncertainty information through processing and delivery so that it is available at the point of use. This makes the analysis more accountable and gives the team a clearer basis for deciding which additional evidence would most improve the outcome.
Sources & further reading
Explore the bhumisat spacecraft concept and our vision towards 2030, or return to the journal.