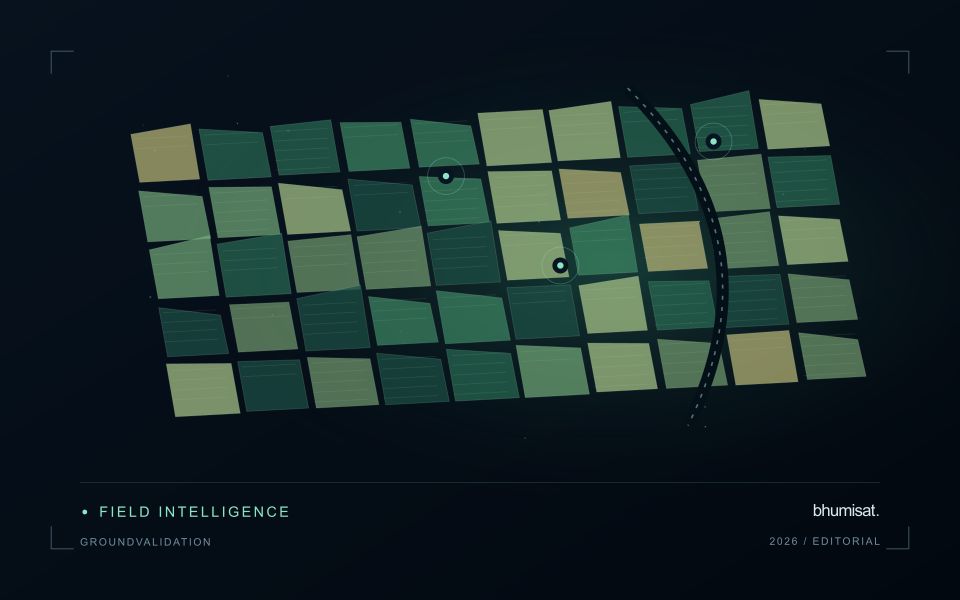
A workflow that succeeds on a small study area may encounter different constraints when the number of observations, locations, or users increases. Scaling requires attention to processing capacity, data organisation, reference coverage, and the effort needed to review results. This perspective looks beyond whether a calculation can run on a larger dataset. It asks whether the complete service can preserve its meaning, quality, and delivery commitments as its scope expands. The objective is a design that identifies bottlenecks early and increases throughput without silently weakening the evidence available to users.
This working guide considers designing ground validation for satellite products in cassava production plots. The immediate decision is to select plots for crop-stage assessment. Useful reference evidence includes planting records, canopy cover and dated plot visits. The case is an illustrative planning context, with assumptions to check against the actual sensor, landscape and project requirements.
Start with the intended claim
Validation tests how well a product represents a defined quantity under specified conditions. It differs from calibration, which adjusts an instrument or model using reference information. Begin with the claim the product needs to support: class membership, surface reflectance, canopy height, water quality, or an area estimate. State the required spatial scale, time interval, and acceptable error. These choices determine the reference method and sample design. Collecting convenient field points first and deciding later what they prove usually leaves important conditions untested.
Reference measurements also contain uncertainty. Positioning error can place a sample in the wrong satellite pixel, a point instrument may not represent a heterogeneous footprint, and measurements made on different dates can describe real surface change. Record instrument calibration, sampling protocols, timestamps, coordinates, observation conditions, and uncertainty where available. For interpreted labels, retain the evidence used, class rules, and ambiguous cases. Agreement among interpreters is useful to examine, but agreement alone does not guarantee that the shared interpretation is correct.
Keep the assessment independent
Separate validation data from observations used to fit thresholds, train models, select features, or tune processing. If assessment sites repeatedly influence revisions, they have become development data and a fresh independent assessment is needed. Spatially clustered samples can make performance look stronger when neighboring training and test locations share conditions. Use a design that reflects the target population and report its limitations, including inaccessible areas or environmental conditions missing from the sample.
Choose metrics that match the product. For categorical maps, examine a confusion matrix and errors for individual classes, not just overall agreement. For continuous measurements, report bias and a suitable error measure alongside sample count and the range of reference values. Plot residuals against relevant conditions to expose failures hidden by an average. For area estimates, carry the probability sampling design through estimation and uncertainty calculations. Preserve rejected matchups and their reasons so that quality screening remains auditable. A useful validation report explains where the product works, where evidence is sparse, and which errors matter for the intended decision. Publishing reference protocols and assessment code makes later comparisons more credible and helps others reproduce the evaluation.
The setting: Cassava production plots
Cassava plots may have different planting dates, harvest strategies and mixtures of neighbouring vegetation. The commercial product develops below ground, while an optical satellite primarily observes the surface and canopy. This distinction is fundamental to the monitoring objective. A visible vegetation pattern can support investigation of plot development or cover, but a claim about root production needs a demonstrated relationship with representative harvest measurements for the relevant production setting.
Start with boundaries that describe the area actually planted and a calendar that captures establishment and any partial harvesting. Small plots can contain substantial mixed pixels along their margins, particularly where paths, trees or other crops surround them. Track the proportion of valid observations and the spatial support used for each summary. Repeated measurements should be compared in a way that accounts for plot age rather than assuming all cassava fields share a single seasonal cycle.
Field visits should record crop stage, canopy continuity, intercropping and management events that might explain the image pattern. Sampling locations need enough context to identify whether they represent the plot interior or an edge mixture. If an analytical model is developed, reserve independent plots or periods for evaluation and communicate its limits. A dependable first service may be a plot inventory and inspection workflow, with more specific production claims added only when the evidence supports them.
Preserve a reproducible processing history
A result should be linked to the inputs and processing choices that produced it. Record source identifiers, software versions, configuration values, reference data versions, and the time of processing. The record does not need to expose every internal implementation detail to the end user. It must preserve enough information for the producing team to investigate a result, reproduce a comparison, and explain why a revised product differs from an earlier version.
Version changes that can affect the meaning of the output. Updated boundaries, a new quality mask, revised calibration, different model parameters, or altered aggregation rules can all change results even when the source imagery is unchanged. Avoid overwriting an earlier product without retaining a suitable history. A clear relationship between versions helps users distinguish an improvement in processing from a real change in the observed surface.
Use representative regression cases when modifying the workflow. Select cases that cover ordinary conditions and known failure modes, then compare meaningful outputs before and after the change. Investigate differences against the intended purpose of the revision rather than assuming that a closer visual match is always preferable. Preserve the review decision with the version record. Reproducibility becomes practical when the team can trace a result through a documented sequence of inputs, transformations, tests, and delivery decisions.
Establish a metadata contract
Define a small set of metadata that every observation and derived product must carry through the workflow. Useful fields include a stable identifier, acquisition time, geographic reference, spatial coverage, measurement units, source version, and processing status. The purpose is not to collect every possible detail. It is to preserve the information required to interpret, compare, locate, and reproduce the observations that the application depends on.
Specify field names, allowed formats, and the meaning of missing values. A blank field, a value of zero, and a measurement below a detection threshold are different states and should remain distinguishable. Time zones, coordinate order, and unit conversions deserve particular attention because inconsistent conventions can produce plausible-looking results that are difficult to diagnose. Validate the metadata when information enters the system, while the source and collection context remain available.
Treat the metadata contract as part of the delivery interface. A product passed to another team should retain the identifiers needed to trace its source and processing history. If a transformation changes the meaning of a field, create a new field or document the change rather than reusing the original name silently. A clear contract reduces ambiguity between field collectors, analysts, software components, and the eventual users of the information.
Bring the evidence back to the decision
Expansion should be guided by measured workload, visible quality conditions, and an understanding of which tasks require expert attention. Test the workflow under representative data volumes before treating a successful demonstration as evidence of operational capacity. Preserve a route for investigating individual observations even when most processing is automated. A scalable service keeps its results traceable and useful as it grows, with clear choices about where to automate, where to review, and where to invest in additional evidence.
Sources & further reading
Explore the bhumisat spacecraft concept and our vision towards 2030, or return to the journal.