Remote observations show patterns, while practical decisions depend on explaining what those patterns could mean. Interpretation therefore requires more than locating a high or low value on a map. A useful analysis considers the timing of the observation, the physical processes that influence the measurement, and the information available from complementary sources. This perspective separates an observed signal from a proposed explanation and from an action recommended to a user. Keeping those stages distinct makes it easier to investigate alternative causes, communicate ambiguity, and choose a proportionate next step.
This working guide considers geolocation accuracy for field-level monitoring in planted timber stands. The immediate decision is to review stand development and harvest boundaries. Useful reference evidence includes planting years, stand management and inventory plot measurements. The case is an illustrative planning context, with assumptions to check against the actual sensor, landscape and project requirements.
The setting: Planted timber stands
A planted timber estate commonly contains stands at different ages and management stages. Newly established areas, closed-canopy stands and recently harvested blocks should not be compared as though their image responses were expected to match. A stand register provides the context for interpreting these differences. Connect boundaries with planting year, species or management group where known, and the operations that could change the canopy during the reporting period.
Remote observations can help organise questions about stand development, harvest extent or unexpected changes within a block. The choice of spatial scale should reflect the stand size and the detail genuinely resolved by the data. Roads, firebreaks, unplanted strips and conservation areas may influence block summaries. When evaluating a trend, inspect image quality and maintain a consistent record of the area contributing valid observations rather than relying on an unqualified average.
Field inventory should record the variables required by the proposed application, such as tree dimensions, stand density or canopy condition, with a clear sampling design. An image-derived cover pattern is not automatically a measurement of timber volume. Relationships used for production or biomass estimation need evaluation across relevant ages and management conditions. A useful initial service may be an auditable stand-development and harvest-monitoring workflow whose mapped observations can be checked against operation records and independent field evidence.
Absolute location and relative alignment answer different questions
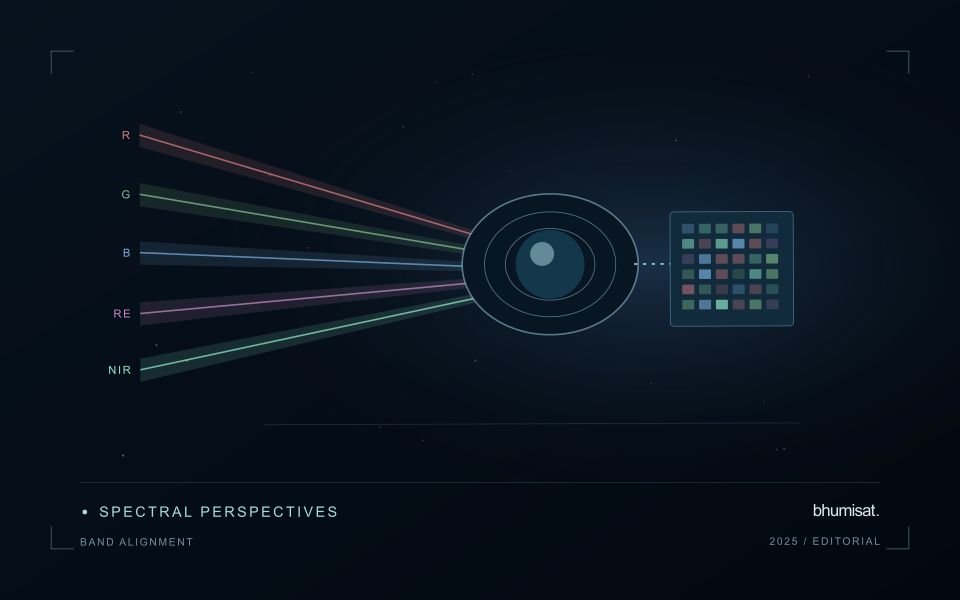
Geolocation describes where an observation is placed on Earth. For a field-level application, its quality affects which measurements are assigned to each management unit and whether an alert can be found during inspection. Absolute accuracy concerns the relationship with a suitable geographic reference. Relative alignment concerns the relationship between observations, such as images from different dates. A series can align well internally while still being displaced from a field boundary dataset. Both relationships should be considered when they matter to the intended decision.
The geographic reference includes more than a familiar coordinate system label. Map projection, datum, axis order, units and any relevant height reference can affect how data are combined. Field boundaries also have an origin and uncertainty of their own. A boundary drawn from an old image may not represent the current cultivated area, even if the satellite product is positioned correctly. Preserve the provenance of both the image and vector data, and distinguish a positional mismatch from a real change in land management.
Test accuracy at the management scale
Accuracy assessment needs independent, appropriate reference information distributed across the area of interest. Choosing only easy points can underrepresent difficult terrain or surface conditions. Define the feature being measured and check that it is identifiable at the image's spatial scale. Report the evaluation method and the distribution of residuals, rather than relying only on a single average error. A visual overlay is useful for finding issues, but it is not a substitute for an assessment designed around the accuracy claim being made.
The acceptable error depends on the task. A displacement that has little effect on a large plantation block may be consequential for a narrow field or a small validation plot. Evaluate how plausible location errors influence the derived statistic or operational instruction. Where necessary, revise the reporting unit, improve the reference data or obtain a complementary observation. The objective is not an impressive accuracy number in isolation. It is a defensible connection between the satellite measurement, the field record and the place where a person will use the result.
Maintain the geographic units of analysis
Many observation services summarise measurements within a field, management block, catchment, forest unit, or other mapped boundary. The meaning of that summary depends on whether the boundary accurately represents the unit being discussed. Start with a clear source for the geometry and record its date, coordinate reference, and intended use. A boundary drawn for visual orientation may require additional checking before it becomes a measurement unit.
Inspect overlaps, gaps, narrow fragments, and features that may have changed since mapping. A geometrically valid polygon can still describe an outdated operational unit. Ask the responsible team how divisions, mergers, new infrastructure, and management changes are recorded. Where pixels or reference measurements cross a boundary, define how they are assigned or excluded so that results remain comparable between analysts and processing runs.
Version the boundaries alongside the observations. If a unit changes, preserve a relationship between the previous and revised geometry rather than replacing the history without explanation. Comparisons through time should identify whether they use a constant spatial unit or the operational units valid at each date. This makes it easier to distinguish a change in the measured surface from a change introduced by the geography used to summarise it.
Deliver quality flags that users can interpret
Quality information should describe the condition of an observation in terms that remain useful through the workflow. A single valid or invalid label may be sufficient for some calculations, but operational users often need to know why an observation was qualified. Distinguish acquisition limitations, processing failures, uncertain reference matches, and conditions that make interpretation ambiguous. These categories point towards different responses and should not be merged without a clear purpose.
Define a small, documented set of flags with stable meanings. Record whether a flag applies to a complete scene, a geographic unit, an individual measurement, or a derived result. A unit containing a mixture of qualified and unqualified observations may also require a coverage measure. Include the rule used to combine flags when summarising data so that a favourable average does not conceal a substantial fraction of unusable input.
Test the flags with the people receiving the product. Ask what they would do differently for each state and whether the terminology supports that choice. Keep the original flags available even if the interface presents a simpler summary. When flag definitions change, version the rules and review their effects on historical comparisons. Useful quality communication makes the condition of the evidence visible at the moment when a user decides how much confidence to place in the result.
Bring the evidence back to the decision
A strong interpretation states what was observed, which explanations remain plausible, and what additional evidence would help distinguish them. Avoid presenting a convenient label as a confirmed cause when the measurements support only a broader pattern. Connect the proposed next step to the significance of the decision and the confidence available. This creates an interpretation that a field team, analyst, or project partner can examine, challenge, and improve as further observations become available.
Sources & further reading
Explore the bhumisat spacecraft concept and our vision towards 2030, or return to the journal.