A workflow that succeeds on a small study area may encounter different constraints when the number of observations, locations, or users increases. Scaling requires attention to processing capacity, data organisation, reference coverage, and the effort needed to review results. This perspective looks beyond whether a calculation can run on a larger dataset. It asks whether the complete service can preserve its meaning, quality, and delivery commitments as its scope expands. The objective is a design that identifies bottlenecks early and increases throughput without silently weakening the evidence available to users.
This working guide considers geolocation accuracy for field-level monitoring along river water corridors. The immediate decision is to prioritise river reaches for sampling. Useful reference evidence includes sampling time, river stage and reach-specific water observations. The case is an illustrative planning context, with assumptions to check against the actual sensor, landscape and project requirements.
The setting: River water corridors
A river corridor can vary quickly in width, bank exposure, flow conditions and the surrounding land cover. A remotely observed reach may include water, sediment, vegetation and structures within the same footprint. Define the monitoring question before choosing an interpretation scale. Mapping the position of visible water, investigating a colour change and estimating a particular water-quality variable are different tasks, even where they draw on the same acquisition.
Spatial resolution and geometric alignment are critical for narrow reaches. A small offset can change how much bank or vegetation contributes to a measurement. Cloud, shadow, surface reflection and adjacency effects can further complicate optical interpretation. Compare suitable acquisitions and retain the exact dates supporting each reach summary. Where river conditions change rapidly, consider whether the available observation frequency is sufficient for the decision the service is intended to support.
Field sampling should identify the sampled reach, location and collection time, together with river conditions that affect comparability. A single bank-side sample may not describe the full width or a downstream reach observed at another time. A spectral anomaly can help select an investigation site without establishing its cause. More specific claims require a validated relationship with representative measurements, while a transparent water and reach inventory can already make a sampling programme more systematic.
Absolute location and relative alignment answer different questions
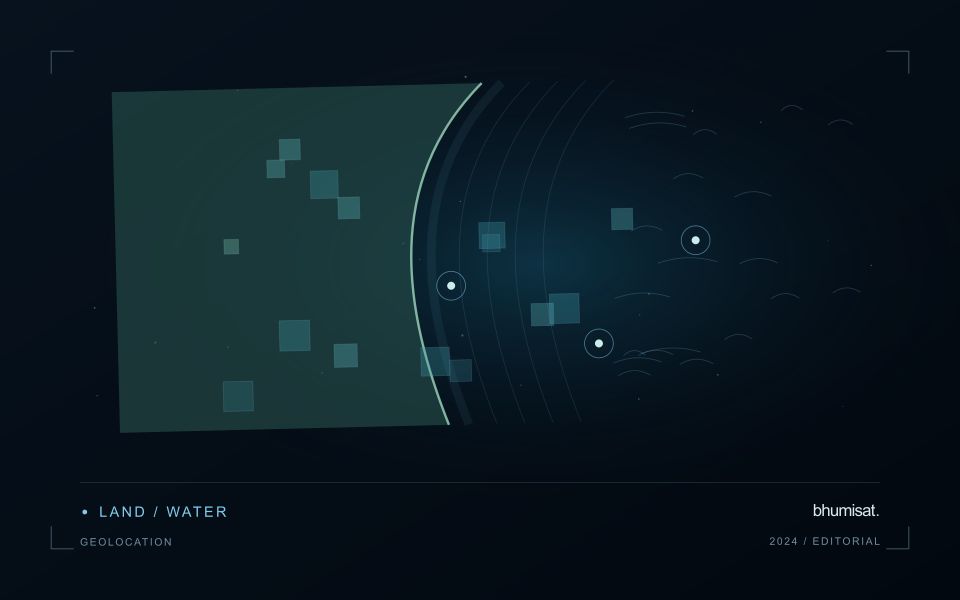
Geolocation describes where an observation is placed on Earth. For a field-level application, its quality affects which measurements are assigned to each management unit and whether an alert can be found during inspection. Absolute accuracy concerns the relationship with a suitable geographic reference. Relative alignment concerns the relationship between observations, such as images from different dates. A series can align well internally while still being displaced from a field boundary dataset. Both relationships should be considered when they matter to the intended decision.
The geographic reference includes more than a familiar coordinate system label. Map projection, datum, axis order, units and any relevant height reference can affect how data are combined. Field boundaries also have an origin and uncertainty of their own. A boundary drawn from an old image may not represent the current cultivated area, even if the satellite product is positioned correctly. Preserve the provenance of both the image and vector data, and distinguish a positional mismatch from a real change in land management.
Test accuracy at the management scale
Accuracy assessment needs independent, appropriate reference information distributed across the area of interest. Choosing only easy points can underrepresent difficult terrain or surface conditions. Define the feature being measured and check that it is identifiable at the image's spatial scale. Report the evaluation method and the distribution of residuals, rather than relying only on a single average error. A visual overlay is useful for finding issues, but it is not a substitute for an assessment designed around the accuracy claim being made.
The acceptable error depends on the task. A displacement that has little effect on a large plantation block may be consequential for a narrow field or a small validation plot. Evaluate how plausible location errors influence the derived statistic or operational instruction. Where necessary, revise the reporting unit, improve the reference data or obtain a complementary observation. The objective is not an impressive accuracy number in isolation. It is a defensible connection between the satellite measurement, the field record and the place where a person will use the result.
Connect observations within a catchment
Water-related observations often depend on processes beyond the immediate pixel or sampling location. Begin by identifying the geographic relationships that are relevant to the question: upstream areas, connected drainage paths, contributing land uses, and the receiving water body. A local pattern may be easier to interpret when placed within that wider setting. The catchment boundary is a useful organising unit, but its suitability should be checked against the process and observation scale.
Combine the remote observation with contextual records that can help explain its timing and spatial pattern. Rainfall, water level, land management, and known interventions can influence what is observed. Preserve the dates and geographic meaning of those records rather than treating them as timeless attributes. Where drainage connections are uncertain or change with conditions, state the limitation and consider whether additional mapping or reference observations would materially improve the interpretation.
Plan reference sampling across locations that distinguish plausible explanations. A set of measurements concentrated at an easily accessible outlet may provide a different view from one that also represents tributaries, source areas, and contrasting conditions. Document how each location contributes to the evaluation. Interpret spatial agreement with care, because connected observations can share influences and may not provide independent evidence. The resulting workflow should connect local measurements with a defensible account of the wider system they help describe.
Define a representative reference sample
A reference sample should represent the situations in which a method will be used. Begin by defining the target population: locations, time periods, management conditions, surface types, or instrument states that belong within the intended application. A collection of convenient observations may be valuable for exploration, but it does not automatically support conclusions about that wider population. Make the scope of the sample visible before calculating a summary of performance.
Consider a stratified design when important conditions are unevenly represented. Relevant strata might include different landscape types, developmental stages, observation quality levels, or ranges of the variable being estimated. Choose sample locations within those groups using a documented rule, and retain the information needed to understand their selection. Where access restrictions affect the sample, record the excluded conditions so that the limits of the resulting evaluation remain clear.
Keep development and evaluation evidence separate where the purpose of the study requires an independent test. Nearby observations or repeated measurements can share information, so a random split of individual records may overstate independence. A split organised by location, period, or operational unit can provide a more demanding comparison. The appropriate design follows the intended deployment, the structure of the observations, and the errors that matter to the user.
Bring the evidence back to the decision
Expansion should be guided by measured workload, visible quality conditions, and an understanding of which tasks require expert attention. Test the workflow under representative data volumes before treating a successful demonstration as evidence of operational capacity. Preserve a route for investigating individual observations even when most processing is automated. A scalable service keeps its results traceable and useful as it grows, with clear choices about where to automate, where to review, and where to invest in additional evidence.
Sources & further reading
Explore the bhumisat spacecraft concept and our vision towards 2030, or return to the journal.