Comparisons through time are valuable only when the observations are sufficiently comparable for the question being asked. A difference between dates can reflect real change, a normal stage in a seasonal cycle, or a difference in how the surface was observed. This perspective examines the reference period, the timing of acquisitions, and the contextual records needed to interpret a sequence. It encourages the use of appropriate baselines rather than treating every previous observation as an equivalent benchmark. The objective is to identify changes that remain meaningful after normal variation and measurement conditions are considered.
This working guide considers geolocation accuracy for field-level monitoring along riparian woodland corridors. The immediate decision is to review changes in river-side vegetation. Useful reference evidence includes bank locations, water conditions and canopy boundary observations. The case is an illustrative planning context, with assumptions to check against the actual sensor, landscape and project requirements.
Absolute location and relative alignment answer different questions
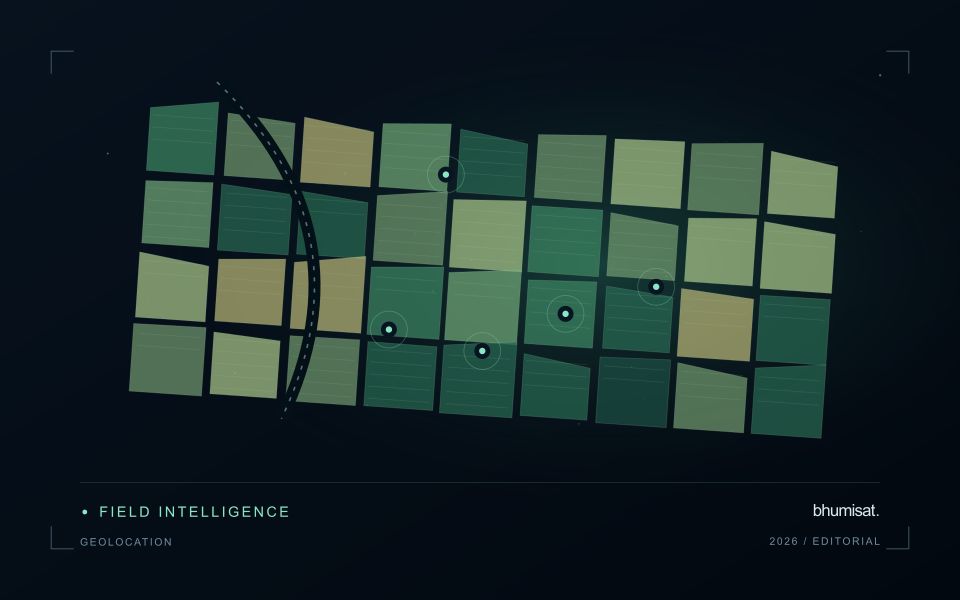
Geolocation describes where an observation is placed on Earth. For a field-level application, its quality affects which measurements are assigned to each management unit and whether an alert can be found during inspection. Absolute accuracy concerns the relationship with a suitable geographic reference. Relative alignment concerns the relationship between observations, such as images from different dates. A series can align well internally while still being displaced from a field boundary dataset. Both relationships should be considered when they matter to the intended decision.
The geographic reference includes more than a familiar coordinate system label. Map projection, datum, axis order, units and any relevant height reference can affect how data are combined. Field boundaries also have an origin and uncertainty of their own. A boundary drawn from an old image may not represent the current cultivated area, even if the satellite product is positioned correctly. Preserve the provenance of both the image and vector data, and distinguish a positional mismatch from a real change in land management.
Test accuracy at the management scale
Accuracy assessment needs independent, appropriate reference information distributed across the area of interest. Choosing only easy points can underrepresent difficult terrain or surface conditions. Define the feature being measured and check that it is identifiable at the image's spatial scale. Report the evaluation method and the distribution of residuals, rather than relying only on a single average error. A visual overlay is useful for finding issues, but it is not a substitute for an assessment designed around the accuracy claim being made.
The acceptable error depends on the task. A displacement that has little effect on a large plantation block may be consequential for a narrow field or a small validation plot. Evaluate how plausible location errors influence the derived statistic or operational instruction. Where necessary, revise the reporting unit, improve the reference data or obtain a complementary observation. The objective is not an impressive accuracy number in isolation. It is a defensible connection between the satellite measurement, the field record and the place where a person will use the result.
The setting: Riparian woodland corridors
Riparian woodland forms a narrow and often irregular corridor beside a river or drainage network. Its observed appearance can change with water level, exposed sediment, neighbouring agriculture and the canopy itself. The first task is to define the corridor consistently and decide what the analysis should establish. Mapping woody-cover continuity, locating a possible clearing and evaluating a particular habitat attribute are different objectives even when they use some of the same imagery.
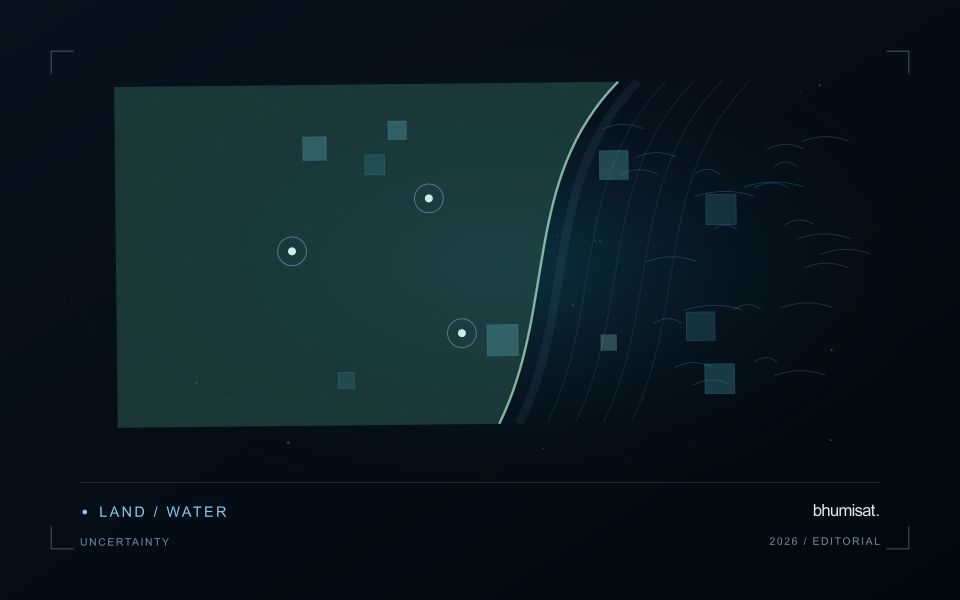
Narrow corridors are sensitive to mixed pixels and spatial alignment. A small offset can move an observation from tree cover into water or a neighbouring field. Review the suitability of the image resolution and boundary information before interpreting small changes. Comparisons should account for water context and image quality as well as seasonal vegetation conditions. Retain the dates and valid areas supporting each corridor-level summary or mapped change.
Field observations should locate the bank and canopy boundaries and describe the neighbouring surfaces represented by a sample. Include different corridor widths and vegetation arrangements in evaluation rather than assuming that one accessible site represents the whole network. A remotely observed break in cover may help focus a visit, but its cause needs investigation. More specific ecological interpretations require reference measurements designed for those outcomes, alongside the spatial evidence used to describe the corridor.
Stratify forest reference observations
Forest landscapes can contain substantial variation in structure, composition, management history, and observation conditions. A reference plan should identify the forms of variation that matter to the intended analysis. Start with a clear target population and use available information to define meaningful strata. The objective is to represent the conditions in which the method will be used, rather than collecting only the most accessible or visually uniform examples.
Match the reference unit to the scale of the remote measurement. A field plot, an individual tree observation, and an image pixel can describe different portions of the canopy and ground. Record plot geometry, position, measurement time, and the procedures used to handle boundaries or incomplete coverage. Where geographic uncertainty is important relative to plot size, evaluate its potential effect before treating a difference between sources as a failure of the analytical method.
Keep the estimation and evaluation questions distinct. Reference measurements used to fit a relationship do not automatically provide an independent test of that relationship. Consider holding out suitable locations or forest conditions when evaluating transfer. Report the range of structure and conditions represented by the evidence, together with important gaps. A stratified reference programme becomes useful when it supports a clear interpretation of where a result is well supported and where further observations are required.
Define a representative reference sample
A reference sample should represent the situations in which a method will be used. Begin by defining the target population: locations, time periods, management conditions, surface types, or instrument states that belong within the intended application. A collection of convenient observations may be valuable for exploration, but it does not automatically support conclusions about that wider population. Make the scope of the sample visible before calculating a summary of performance.
Consider a stratified design when important conditions are unevenly represented. Relevant strata might include different landscape types, developmental stages, observation quality levels, or ranges of the variable being estimated. Choose sample locations within those groups using a documented rule, and retain the information needed to understand their selection. Where access restrictions affect the sample, record the excluded conditions so that the limits of the resulting evaluation remain clear.
Keep development and evaluation evidence separate where the purpose of the study requires an independent test. Nearby observations or repeated measurements can share information, so a random split of individual records may overstate independence. A split organised by location, period, or operational unit can provide a more demanding comparison. The appropriate design follows the intended deployment, the structure of the observations, and the errors that matter to the user.
Bring the evidence back to the decision
A useful comparison preserves the dates, quality conditions, and contextual assumptions behind its baseline. Review unusual results against the actual observation sequence rather than relying entirely on a summary statistic. Where seasonal timing is important, describe how comparable stages were identified. The resulting analysis should help users distinguish an informative change from an expected cycle or an observation artefact, while making gaps and remaining uncertainty visible enough to guide further investigation.
Sources & further reading
Explore the bhumisat spacecraft concept and our vision towards 2030, or return to the journal.