Every observation and interpretation contains uncertainty, but the sources and consequences of that uncertainty differ between applications. Some arise from acquisition conditions, others from reference measurements, processing choices, or the transfer of a model to a new setting. This perspective examines how those sources affect the decision a user is considering. It encourages teams to describe uncertainty in a form that can influence action, rather than adding a generic qualification at the end of a report. The objective is to support proportionate decisions while keeping the limits of the available evidence understandable.
This working guide considers reading vertical forest structure from remote sensing in humid tropical forests. The immediate decision is to prioritise forest-change inspections. Useful reference evidence includes canopy observations, disturbance evidence and representative plots. The case is an illustrative planning context, with assumptions to check against the actual sensor, landscape and project requirements.
The setting: Humid tropical forests
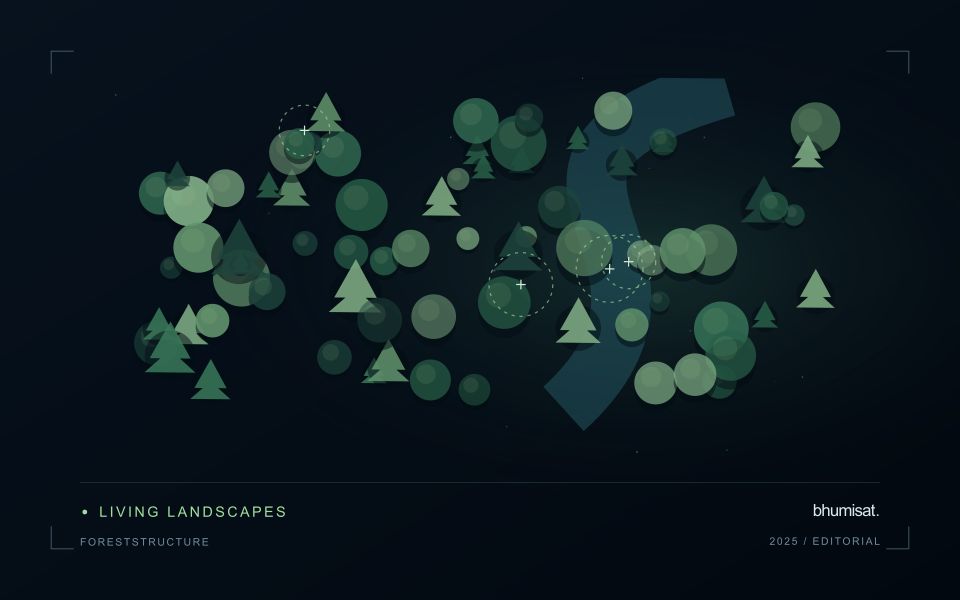
A humid tropical forest presents a complex upper canopy shaped by species mixtures, crown structure, terrain and disturbance history. Optical imagery can describe aspects of that visible surface, but it does not directly inventory every tree or the conditions beneath the canopy. Define whether the intended task concerns cover change, a disturbance alert or a forest parameter before interpreting an image pattern. These objectives require different reference information and different levels of spatial support.
Persistent cloud, shadow and haze can leave gaps in the observation record. A change map should show when usable evidence was available and whether a reported event is constrained to a broad interval between acquisitions. Terrain and canopy shadows can create additional differences that are unrelated to a new disturbance. Combine quality screening with an understanding of the landscape, and retain the dates and valid areas used to establish each mapped observation.
Field validation should distinguish a change in canopy appearance from the explanation for that change. Record plot or inspection locations, the area represented and the evidence used to identify disturbance or recovery. Tree measurements can support structural or biomass studies when collected and analysed for that purpose. A general vegetation index alone cannot establish forest carbon stocks. The practical monitoring product should state what was observed, how confidently it was located and which additional information supports its interpretation.
Separate structure from greenness
Two forests can look equally green from above while having very different heights, canopy gaps, and distributions of leaves and branches. Those structural differences influence habitat, stored carbon, and how light reaches the ground. Optical imagery mainly measures reflected radiation from surfaces visible to the sensor. It can support structural modeling, but vegetation indices alone do not directly measure a three dimensional canopy. A practical study starts by choosing a target such as canopy height, canopy cover, vertical foliage distribution, or aboveground biomass, because these quantities need different reference measurements.
Lidar estimates range from the travel time of laser energy. Returns distributed between the canopy top and ground contain information about vertical arrangement. Interpreting a waveform requires identifying the ground contribution and accounting for slope, footprint location, and signal quality. A laser footprint samples an area rather than every tree, and spaceborne footprints do not form a continuous wall to wall height survey. Radar offers complementary structural sensitivity, but moisture, viewing geometry, and saturation can weaken a simple relationship between backscatter and biomass.
Scale samples into useful maps
Before combining lidar footprints with imagery, filter observations using documented quality criteria and inspect their spatial distribution. Geolocation uncertainty matters near a forest edge, road, or abrupt height transition. Match field plots, lidar footprints, and predictor pixels at comparable spatial scales. The date difference also matters: a field measurement before harvesting should not be treated as a reference for an image after harvesting. Models should represent the forest types and height ranges where predictions will be used.
Use independent plots or withheld geographic regions to evaluate height and biomass predictions. Report bias and error across structural ranges, since a model can underestimate tall stands while appearing accurate on average. Biomass additionally depends on relationships among dimensions, species, wood density, and measured mass; a height map is therefore not automatically a carbon inventory. When producing regional summaries, distinguish uncertainty in individual predictions from uncertainty in an area estimate. Preserve sample locations, calibration assumptions, masks, and model versions. These details let readers judge whether a continuous map is supported by observations or is extrapolating into forests unlike those represented in the training data.
Translate the decision into observation requirements
Start with the decision that the information is intended to support. Describe the geographic unit, the time available for acting, and the consequence of an incorrect interpretation. A requirement such as detecting an unusual pattern across management blocks is different from identifying its cause. Keeping that distinction explicit helps a team select measurements that are relevant to the application and prevents later evaluation from drifting towards whatever result happens to be easiest to demonstrate.
Build a compact requirements matrix linking each decision to the evidence needed, the proposed observation source, and an acceptance condition. Include geographic accuracy, temporal relevance, quality screening, and the context required for interpretation. The matrix should also identify the evidence used to justify each requirement. An engineering preference or a convenient data source can inform a study, but neither should silently replace a documented information need.
Review the matrix with the people who will use the result. Ask how their response would change when information is delayed, incomplete, or uncertain. Record unresolved requirements as questions for a pilot rather than converting them into confident specifications. This produces a practical framework for comparing technical options, designing tests, and explaining why an observation is useful to the intended workflow.
Deliver quality flags that users can interpret
Quality information should describe the condition of an observation in terms that remain useful through the workflow. A single valid or invalid label may be sufficient for some calculations, but operational users often need to know why an observation was qualified. Distinguish acquisition limitations, processing failures, uncertain reference matches, and conditions that make interpretation ambiguous. These categories point towards different responses and should not be merged without a clear purpose.
Define a small, documented set of flags with stable meanings. Record whether a flag applies to a complete scene, a geographic unit, an individual measurement, or a derived result. A unit containing a mixture of qualified and unqualified observations may also require a coverage measure. Include the rule used to combine flags when summarising data so that a favourable average does not conceal a substantial fraction of unusable input.
Test the flags with the people receiving the product. Ask what they would do differently for each state and whether the terminology supports that choice. Keep the original flags available even if the interface presents a simpler summary. When flag definitions change, version the rules and review their effects on historical comparisons. Useful quality communication makes the condition of the evidence visible at the moment when a user decides how much confidence to place in the result.
Bring the evidence back to the decision
Useful uncertainty communication identifies the limitation, explains how it could affect the result, and connects it to a practical response. Some decisions can proceed with a qualified estimate; others require another observation or an independent check. Preserve uncertainty information through processing and delivery so that it is available at the point of use. This makes the analysis more accountable and gives the team a clearer basis for deciding which additional evidence would most improve the outcome.
Sources & further reading
Explore the bhumisat spacecraft concept and our vision towards 2030, or return to the journal.