An analytical result becomes operational information only when the receiving team can understand it and use it within existing responsibilities. Handoffs often fail because assumptions that were obvious to the analyst are absent from the delivered product. This perspective considers the information needed at that boundary: acquisition time, processing status, geographic scope, quality qualifications, and the action expected from the recipient. It also asks how corrections and feedback should return to the producing team. A dependable handoff creates a shared understanding of the result, rather than merely transferring a file.
This working guide considers mapping flood extent with optical and radar imagery over inland reservoir waters. The immediate decision is to select water-sampling locations. Useful reference evidence includes water samples, acquisition timing and reservoir-level context. The case is an illustrative planning context, with assumptions to check against the actual sensor, landscape and project requirements.
Read the water signal in context
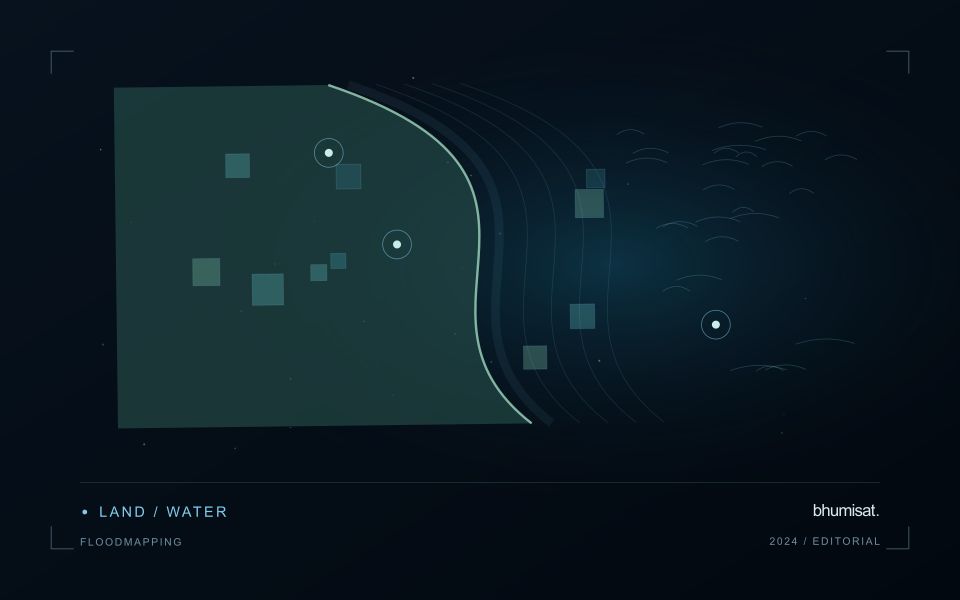
A flood extent map describes water visible at a particular observation time. It does not automatically describe maximum inundation, water depth, or the safety of a road. Begin by defining the event window, study boundary, permanent water baseline, and the smallest flooded area the analysis needs to represent. These decisions determine whether individual scenes, a time series, or several complementary sensors are appropriate. A satellite may pass after a short flood has already receded, so absence of mapped water is not evidence that flooding never occurred.
Optical imagery can separate open water from many surrounding surfaces because water strongly absorbs near infrared and shortwave infrared radiation. Clouds, cloud shadows, turbid water, floating vegetation, and dark roofs complicate that interpretation. Radar can observe through cloud and without sunlight, but its response depends on surface roughness, viewing geometry, polarization, and vegetation. Smooth open water often appears dark; wind can brighten it, while flooded vegetation can produce stronger returns. Neither a universal darkness threshold nor a single water index works reliably in every landscape.
Build and qualify an extent product
For optical analysis, use compatible reflectance products, inspect quality flags, and retain explicit masks for cloud and shadow. For radar, apply the corrections required by the selected product, account for terrain effects, and compare acquisitions with similar viewing geometry. A pre-event reference helps distinguish newly inundated land from reservoirs, wetlands, and persistent channels. Elevation and drainage information can expose implausible isolated detections, but a terrain rule should not silently remove real flooding behind an embankment.
Keep observed flood, permanent water, dry land, and unobserved areas as separate classes. Check results against independent reference observations collected close to acquisition time, including difficult boundaries and built environments. Document missed inundation and false alarms instead of reporting only a visually convincing example. Record acquisition timestamps, sensor and processing versions, thresholds, and validation limitations with the exported layer. When several dates are combined, identify the composite period clearly. An exposure overlay can then intersect the qualified extent with roads, settlements, or fields while preserving the distinction between observed water and inferred consequences.
The setting: Inland reservoir waters
A reservoir image records water alongside shorelines, shallow areas, vegetation and surrounding land. The mixture visible at its margins changes as water level varies. A monitoring programme should distinguish mapping water extent from estimating a particular water-quality variable. These tasks may share observations, but they require different reference data and different rules for excluding surfaces that do not represent the open water of interest.
Optical interpretation depends on atmospheric conditions, surface reflections and the substances influencing the water signal. A bright patch could have several explanations, so an image feature should be treated as a question for investigation unless its relationship with a defined variable has been evaluated. Review clouds, shadows, sun glint and adjacency to bright land. Sampling footprints near a shoreline may need separate treatment because their measurements can include both land and water.
Field validation should connect each water sample to its location, collection time and the conditions relevant to the acquisition. A sample taken after a major change in inflow may not represent what the satellite observed earlier. Include different parts of the reservoir and the range of conditions expected in use. The final product should communicate whether it shows a spectral pattern, a calibrated estimate or a confirmed sampling result, rather than presenting those forms of evidence as identical.
Use observation labels with consistent meanings
A reference label should describe an observation that another person could recognise or reproduce. Broad terms such as good, damaged, or unusual can conceal substantial differences between collection teams. Begin by defining the feature or condition being recorded, the observation unit, and the evidence needed to assign a label. Where possible, distinguish a direct measurement from an interpretation made by the observer.
Provide a short collection guide with examples, boundary cases, and a way to record uncertainty. Train observers using shared cases before relying on independently collected labels. If two observers disagree, preserve the disagreement long enough to understand its cause. It may reveal an unclear definition, a genuinely ambiguous condition, a difference in observation scale, or a problem in matching the reference record to the remote measurement.
Retain the context that makes the label interpretable. Location, time, collection method, observer role, and relevant surface conditions can be essential for later review. Changes to the label scheme should be documented and related to earlier versions where a defensible correspondence exists. Consistent labels do not eliminate uncertainty, but they make it possible to investigate disagreement, evaluate analytical methods, and identify where better definitions or additional measurements would improve the evidence.
Prioritise alerts using evidence and consequence
An alert is a request for attention, so its design should consider both the evidence available and the cost of responding. Begin by distinguishing a measured change, a proposed interpretation, and the action expected from the recipient. A large numerical difference is not automatically the most urgent case. The significance of the location, the age of the observation, the confidence in the interpretation, and the consequences of delay can all influence priority.
Create a review queue with enough context to support consistent decisions. Useful information can include the supporting dates, quality qualifications, previous observations, geographic unit, and the reason the case entered the queue. Define when an alert can be closed, escalated, or held for another observation. A documented rule is easier to improve than an informal practice that depends entirely on the memory of the operator reviewing the result.
Collect feedback from inspections and operational responses. Record alerts that led to a useful finding, alerts that required no action, and important conditions that the system failed to flag. Review these outcomes across different settings rather than relying only on a total count of alerts. The objective is a queue that directs limited attention towards meaningful decisions, while generating evidence for adjusting thresholds, improving context, and reducing repeated sources of unnecessary work.
Bring the evidence back to the decision
A successful handoff leaves the recipient with a clear result, sufficient context, and a practical route for raising questions. Test the delivery with the people who will use it, including how they respond when observations are missing or qualified. Capture their feedback as evidence for improving the product. The most useful delivery format is the one that preserves the relevant technical meaning while fitting the decisions, time constraints, and responsibilities of its intended audience.
Sources & further reading
Explore the bhumisat spacecraft concept and our vision towards 2030, or return to the journal.