A convincing image can still contain measurements that are unsuitable for a particular task. Quality control asks whether the inputs, transformations, and outputs meet the requirements of the intended application. This perspective follows evidence through the workflow, from acquisition metadata and reference observations to the final interpretation. It encourages teams to define acceptance conditions before seeing the result, rather than adjusting them to favour a preferred conclusion. The purpose is a repeatable way to distinguish usable observations, observations requiring qualification, and observations that should be excluded from a decision.
This working guide considers mapping flood extent with optical and radar imagery across estuarine mixing zones. The immediate decision is to plan sampling across estuarine gradients. Useful reference evidence includes tidal stage, sample timing and water-variable measurements. The case is an illustrative planning context, with assumptions to check against the actual sensor, landscape and project requirements.
Read the water signal in context
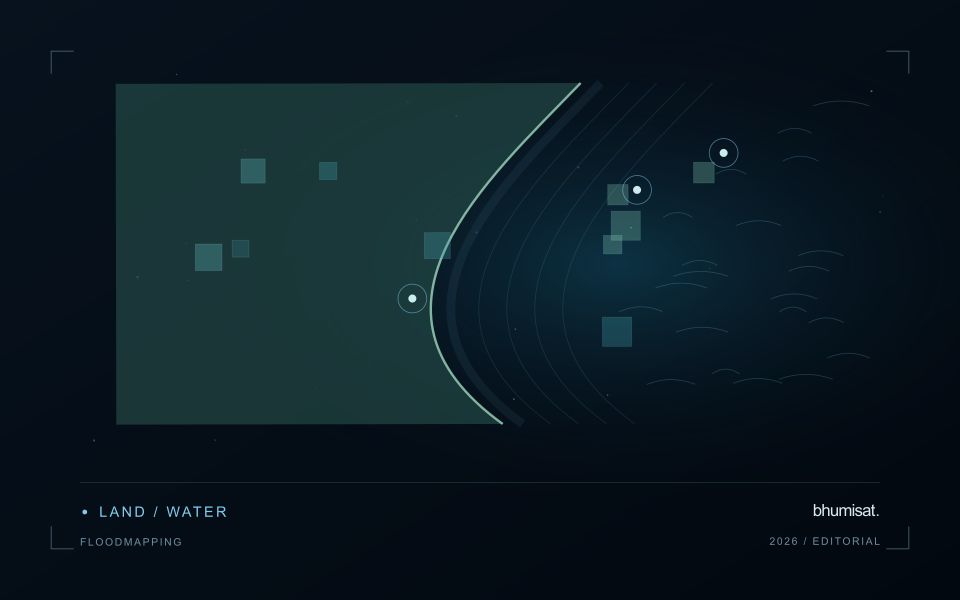
A flood extent map describes water visible at a particular observation time. It does not automatically describe maximum inundation, water depth, or the safety of a road. Begin by defining the event window, study boundary, permanent water baseline, and the smallest flooded area the analysis needs to represent. These decisions determine whether individual scenes, a time series, or several complementary sensors are appropriate. A satellite may pass after a short flood has already receded, so absence of mapped water is not evidence that flooding never occurred.
Optical imagery can separate open water from many surrounding surfaces because water strongly absorbs near infrared and shortwave infrared radiation. Clouds, cloud shadows, turbid water, floating vegetation, and dark roofs complicate that interpretation. Radar can observe through cloud and without sunlight, but its response depends on surface roughness, viewing geometry, polarization, and vegetation. Smooth open water often appears dark; wind can brighten it, while flooded vegetation can produce stronger returns. Neither a universal darkness threshold nor a single water index works reliably in every landscape.
Build and qualify an extent product
For optical analysis, use compatible reflectance products, inspect quality flags, and retain explicit masks for cloud and shadow. For radar, apply the corrections required by the selected product, account for terrain effects, and compare acquisitions with similar viewing geometry. A pre-event reference helps distinguish newly inundated land from reservoirs, wetlands, and persistent channels. Elevation and drainage information can expose implausible isolated detections, but a terrain rule should not silently remove real flooding behind an embankment.
Keep observed flood, permanent water, dry land, and unobserved areas as separate classes. Check results against independent reference observations collected close to acquisition time, including difficult boundaries and built environments. Document missed inundation and false alarms instead of reporting only a visually convincing example. Record acquisition timestamps, sensor and processing versions, thresholds, and validation limitations with the exported layer. When several dates are combined, identify the composite period clearly. An exposure overlay can then intersect the qualified extent with roads, settlements, or fields while preserving the distinction between observed water and inferred consequences.
The setting: Estuarine mixing zones
An estuary connects river inflow, coastal water, tidal conditions and complex shorelines. The resulting image pattern may change even when a monitoring team has not altered its methods. A useful design begins with a specific question, such as mapping visible water or investigating a persistent spectral gradient. It should not assume that one relationship describes every part of the estuary or that a single acquisition represents conditions throughout a tidal cycle.
Comparison units should account for channels, shallow margins and locations where land and water are mixed within an observation. Review cloud and atmospheric quality, surface reflection and geometric alignment before interpreting a difference between dates. Tidal and inflow context can help explain the setting but does not replace measurements of the target variable. Preserve the acquisition times and valid areas so that a mapped feature can be evaluated against the conditions under which it was observed.
A validation plan should represent different water types and spatial positions across the mixing zone. Collect the timing and location of samples consistently, and consider whether conditions changed between sampling and acquisition. A spectral boundary may help organise an investigation without proving a particular source or ecological consequence. More specific interpretations require evidence designed for those claims, while an auditable record of observed patterns and sampling priorities can already improve the structure of a monitoring programme.
Define a representative reference sample
A reference sample should represent the situations in which a method will be used. Begin by defining the target population: locations, time periods, management conditions, surface types, or instrument states that belong within the intended application. A collection of convenient observations may be valuable for exploration, but it does not automatically support conclusions about that wider population. Make the scope of the sample visible before calculating a summary of performance.
Consider a stratified design when important conditions are unevenly represented. Relevant strata might include different landscape types, developmental stages, observation quality levels, or ranges of the variable being estimated. Choose sample locations within those groups using a documented rule, and retain the information needed to understand their selection. Where access restrictions affect the sample, record the excluded conditions so that the limits of the resulting evaluation remain clear.
Keep development and evaluation evidence separate where the purpose of the study requires an independent test. Nearby observations or repeated measurements can share information, so a random split of individual records may overstate independence. A split organised by location, period, or operational unit can provide a more demanding comparison. The appropriate design follows the intended deployment, the structure of the observations, and the errors that matter to the user.
Use observation labels with consistent meanings
A reference label should describe an observation that another person could recognise or reproduce. Broad terms such as good, damaged, or unusual can conceal substantial differences between collection teams. Begin by defining the feature or condition being recorded, the observation unit, and the evidence needed to assign a label. Where possible, distinguish a direct measurement from an interpretation made by the observer.
Provide a short collection guide with examples, boundary cases, and a way to record uncertainty. Train observers using shared cases before relying on independently collected labels. If two observers disagree, preserve the disagreement long enough to understand its cause. It may reveal an unclear definition, a genuinely ambiguous condition, a difference in observation scale, or a problem in matching the reference record to the remote measurement.
Retain the context that makes the label interpretable. Location, time, collection method, observer role, and relevant surface conditions can be essential for later review. Changes to the label scheme should be documented and related to earlier versions where a defensible correspondence exists. Consistent labels do not eliminate uncertainty, but they make it possible to investigate disagreement, evaluate analytical methods, and identify where better definitions or additional measurements would improve the evidence.
Bring the evidence back to the decision
Quality control is most useful when its results travel with the information being delivered. Preserve the reasons for accepting or rejecting an observation, and expose limitations that could change the user's interpretation. Review recurring failures as clues about the design of the workflow. A clear quality record supports consistent comparisons between operators and processing versions, while helping the team decide whether a problem originates in acquisition, preparation, interpretation, or the underlying observation requirements.
Sources & further reading
Explore the bhumisat spacecraft concept and our vision towards 2030, or return to the journal.