Remote observations show patterns, while practical decisions depend on explaining what those patterns could mean. Interpretation therefore requires more than locating a high or low value on a map. A useful analysis considers the timing of the observation, the physical processes that influence the measurement, and the information available from complementary sources. This perspective separates an observed signal from a proposed explanation and from an action recommended to a user. Keeping those stages distinct makes it easier to investigate alternative causes, communicate ambiguity, and choose a proportionate next step.
This working guide considers mapping flood extent with optical and radar imagery around aquaculture pond clusters. The immediate decision is to prioritise pond-cluster monitoring visits. Useful reference evidence includes pond boundaries, operation status and timed water measurements. The case is an illustrative planning context, with assumptions to check against the actual sensor, landscape and project requirements.
Read the water signal in context
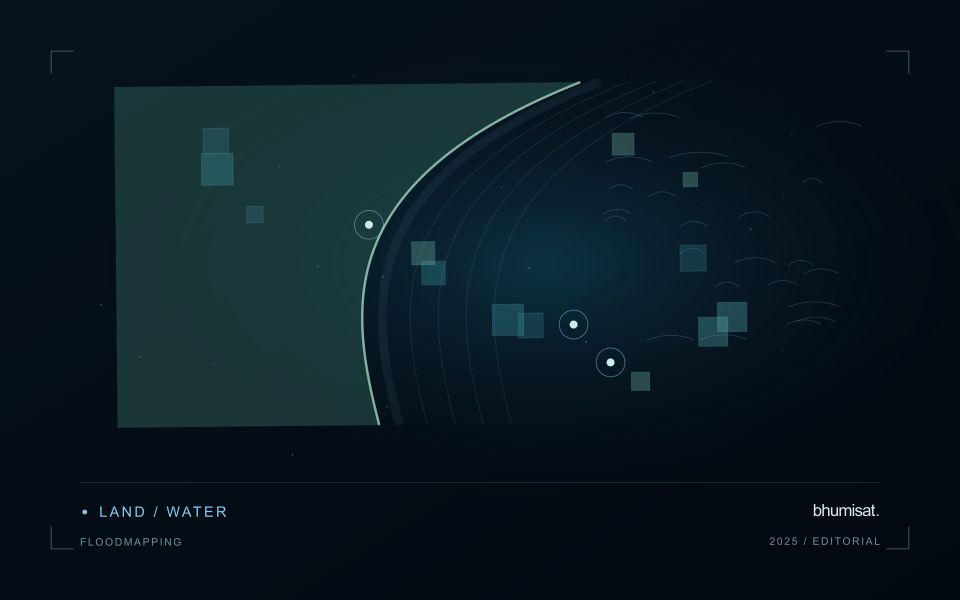
A flood extent map describes water visible at a particular observation time. It does not automatically describe maximum inundation, water depth, or the safety of a road. Begin by defining the event window, study boundary, permanent water baseline, and the smallest flooded area the analysis needs to represent. These decisions determine whether individual scenes, a time series, or several complementary sensors are appropriate. A satellite may pass after a short flood has already receded, so absence of mapped water is not evidence that flooding never occurred.
Optical imagery can separate open water from many surrounding surfaces because water strongly absorbs near infrared and shortwave infrared radiation. Clouds, cloud shadows, turbid water, floating vegetation, and dark roofs complicate that interpretation. Radar can observe through cloud and without sunlight, but its response depends on surface roughness, viewing geometry, polarization, and vegetation. Smooth open water often appears dark; wind can brighten it, while flooded vegetation can produce stronger returns. Neither a universal darkness threshold nor a single water index works reliably in every landscape.
Build and qualify an extent product
For optical analysis, use compatible reflectance products, inspect quality flags, and retain explicit masks for cloud and shadow. For radar, apply the corrections required by the selected product, account for terrain effects, and compare acquisitions with similar viewing geometry. A pre-event reference helps distinguish newly inundated land from reservoirs, wetlands, and persistent channels. Elevation and drainage information can expose implausible isolated detections, but a terrain rule should not silently remove real flooding behind an embankment.
Keep observed flood, permanent water, dry land, and unobserved areas as separate classes. Check results against independent reference observations collected close to acquisition time, including difficult boundaries and built environments. Document missed inundation and false alarms instead of reporting only a visually convincing example. Record acquisition timestamps, sensor and processing versions, thresholds, and validation limitations with the exported layer. When several dates are combined, identify the composite period clearly. An exposure overlay can then intersect the qualified extent with roads, settlements, or fields while preserving the distinction between observed water and inferred consequences.
The setting: Aquaculture pond clusters
An aquaculture landscape contains ponds at different operating stages together with embankments, channels, roads and service areas. A satellite observation may support a pond inventory or a broader review of visible water patterns, but it should not be assumed to measure conditions within every individual production unit. Begin with boundaries and a record of pond status. Empty, recently filled and active ponds can have different appearances for ordinary operational reasons.
The size of a pond relative to the observation footprint determines how much embankment or neighbouring water contributes to a measurement. Review alignment and exclude unsuitable mixed areas where necessary. Surface reflections, cloud and atmospheric conditions can complicate optical comparison, while short-term management changes may occur between usable acquisitions. Retain observation dates and quality masks so that the image record does not imply continuous knowledge of rapidly changing pond conditions.
Validation should record the unit, collection time, operational context and the measurement method for any water variable being studied. A sample from one pond cannot automatically validate an adjacent pond or an entire cluster. A colour anomaly may help select a monitoring visit without establishing a particular biological condition or production outcome. More specific estimates require a demonstrated relationship with representative measurements, while inventory and inspection-priority products can be evaluated against the practical decisions they support.
Keep an auditable review record
A review record should explain how a result moved from an analytical output to an accepted interpretation or operational decision. Preserve the product identifier, the evidence considered, the reviewer role, and the outcome of the review. A short, consistent record is often more useful than an extensive free-text note that cannot be compared between cases. The objective is to make important decisions traceable without turning routine review into unnecessary administrative work.
Separate observations from conclusions within the record. Describe the evidence visible to the reviewer, the alternative explanations considered where relevant, and the reason for accepting, qualifying, or rejecting the result. If a correction is required, identify what should change and how the revised product relates to the earlier version. Keep unresolved questions visible so that they can be addressed by another observation or by the person responsible for the next action.
Use the accumulated record to improve the workflow. Recurring review reasons can reveal unclear requirements, missing contextual information, unstable processing steps, or an evaluation gap. Examine whether similar cases receive similar decisions across reviewers and over time. Preserve the relationship between feedback and subsequent revisions so that improvements can be assessed against the evidence that motivated them. An auditable record supports learning, accountability, and consistent delivery while allowing the technical process to evolve.
Maintain the geographic units of analysis
Many observation services summarise measurements within a field, management block, catchment, forest unit, or other mapped boundary. The meaning of that summary depends on whether the boundary accurately represents the unit being discussed. Start with a clear source for the geometry and record its date, coordinate reference, and intended use. A boundary drawn for visual orientation may require additional checking before it becomes a measurement unit.
Inspect overlaps, gaps, narrow fragments, and features that may have changed since mapping. A geometrically valid polygon can still describe an outdated operational unit. Ask the responsible team how divisions, mergers, new infrastructure, and management changes are recorded. Where pixels or reference measurements cross a boundary, define how they are assigned or excluded so that results remain comparable between analysts and processing runs.
Version the boundaries alongside the observations. If a unit changes, preserve a relationship between the previous and revised geometry rather than replacing the history without explanation. Comparisons through time should identify whether they use a constant spatial unit or the operational units valid at each date. This makes it easier to distinguish a change in the measured surface from a change introduced by the geography used to summarise it.
Bring the evidence back to the decision
A strong interpretation states what was observed, which explanations remain plausible, and what additional evidence would help distinguish them. Avoid presenting a convenient label as a confirmed cause when the measurements support only a broader pattern. Connect the proposed next step to the significance of the decision and the confidence available. This creates an interpretation that a field team, analyst, or project partner can examine, challenge, and improve as further observations become available.
Sources & further reading
Explore the bhumisat spacecraft concept and our vision towards 2030, or return to the journal.