Remote observations show patterns, while practical decisions depend on explaining what those patterns could mean. Interpretation therefore requires more than locating a high or low value on a map. A useful analysis considers the timing of the observation, the physical processes that influence the measurement, and the information available from complementary sources. This perspective separates an observed signal from a proposed explanation and from an action recommended to a user. Keeping those stages distinct makes it easier to investigate alternative causes, communicate ambiguity, and choose a proportionate next step.
This working guide considers choosing evi, savi and related indices in sugarcane production blocks. The immediate decision is to sequence scouting and harvest review. Useful reference evidence includes planting or ratoon dates and dated canopy observations. The case is an illustrative planning context, with assumptions to check against the actual sensor, landscape and project requirements.
Choose the index around the landscape
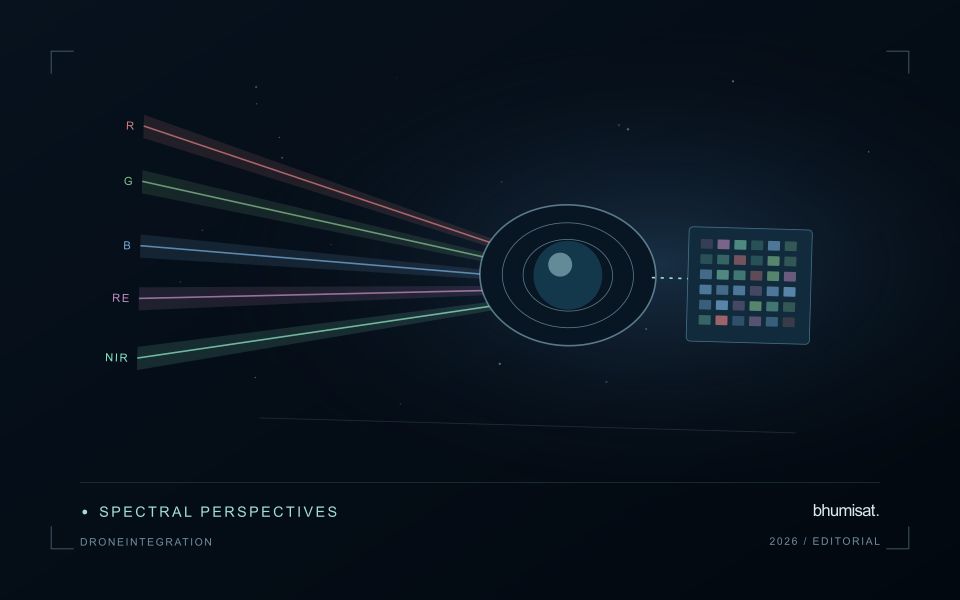
Vegetation indices emphasise selected relationships between spectral measurements. They are alternative views of the same observed surface, not independent diagnoses of a crop. EVI and SAVI were developed to address particular limitations encountered when interpreting vegetation signals, including background and canopy effects. Their usefulness depends on the data and landscape. A workflow should identify which limitation matters in its application before adding another index. Computing many indices without a clear comparison plan can increase complexity while leaving the original question unresolved.
SAVI introduces an adjustment intended to reduce sensitivity to soil brightness when vegetation cover is limited. The adjustment parameter should be chosen deliberately and retained in the processing record. EVI includes additional terms and commonly uses a blue band, making the quality of that measurement relevant to the result. Implementations must use the appropriate reflectance scaling and coefficient conventions. Applying a formula directly to stored integer values without considering offsets and scale factors can produce values that are mathematically calculable yet physically inconsistent.
Test whether the choice improves the decision
Compare candidate indices using the same quality-screened observations, field boundaries and independent evaluation sample. Otherwise a difference in performance might reflect a different set of pixels or dates rather than the index itself. Inspect sparse, intermediate and dense canopy conditions separately. Include soil exposure and recent management operations in the interpretation. A result that appears clearer on a colour map still needs to be tested against the variable of interest or the operational decision the service is expected to support.
The final choice should also account for maintenance and communication. An index that gives a modest improvement but depends on a less reliable band may require additional quality controls. Users should be told which observations were excluded and why a value is missing. Keep the selected method stable during an evaluation period, and version later changes so that historical comparisons remain interpretable. A concise set of well-understood indicators usually supports a stronger service than a long list of unexplained metrics that imply more certainty than the measurements justify.
The setting: Sugarcane production blocks
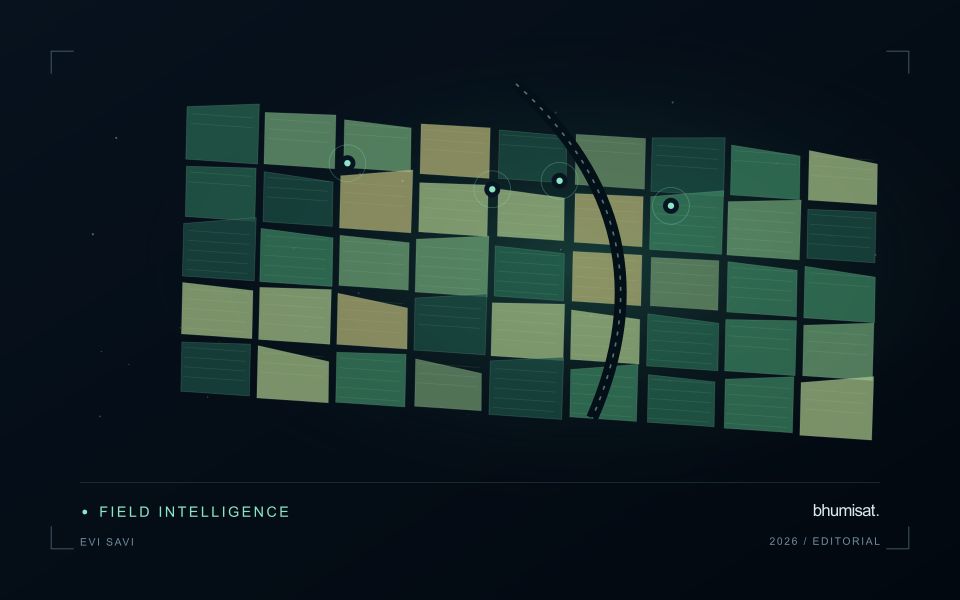
Sugarcane monitoring depends on knowing where each block sits within a management cycle. A recently planted field, an established ratoon and a block approaching harvest can have very different canopy structures without any of them indicating a problem. Maintain planting and harvest dates alongside block boundaries, and distinguish crop establishment from regrowth. This context gives a time series a meaningful starting point and prevents comparisons between fields at unrelated stages.
A useful workflow follows the development of each block through successive quality-screened observations. Look for departures from comparable blocks or from a documented local seasonal pattern, rather than applying a single threshold across the whole estate. Harvest operations, residue management, bare soil and weeds can all affect the surface signal. Track these events in the same record as the imagery so that the analytical timeline reflects what actually happened on the ground.
Field validation should address a defined question, such as whether a flagged area has uneven establishment or requires an agronomic visit. Record crop stage, stand continuity, management history and the location of observations within the block. Predictions related to production need suitable harvest measurements and evaluation across seasons. A map that helps organise scouting is useful evidence of a workflow; it is not automatically a validated estimate of cane tonnage.
Translate the decision into observation requirements
Start with the decision that the information is intended to support. Describe the geographic unit, the time available for acting, and the consequence of an incorrect interpretation. A requirement such as detecting an unusual pattern across management blocks is different from identifying its cause. Keeping that distinction explicit helps a team select measurements that are relevant to the application and prevents later evaluation from drifting towards whatever result happens to be easiest to demonstrate.
Build a compact requirements matrix linking each decision to the evidence needed, the proposed observation source, and an acceptance condition. Include geographic accuracy, temporal relevance, quality screening, and the context required for interpretation. The matrix should also identify the evidence used to justify each requirement. An engineering preference or a convenient data source can inform a study, but neither should silently replace a documented information need.
Review the matrix with the people who will use the result. Ask how their response would change when information is delayed, incomplete, or uncertain. Record unresolved requirements as questions for a pilot rather than converting them into confident specifications. This produces a practical framework for comparing technical options, designing tests, and explaining why an observation is useful to the intended workflow.
Design field observations around the information need
Field observations are most useful when they answer a defined question within the monitoring workflow. Begin by identifying the variable, condition, or management event that needs to be recorded and the geographic unit to which it applies. Distinguish direct measurements from an observer's interpretation. A consistent record of crop stage, management timing, and visible conditions can provide valuable context even when the field team is not collecting a complex set of measurements.
Prepare a collection protocol that reflects the variability of the site. Define where observations are made within a unit, how many locations are represented, and how the position and time are recorded. Avoid selecting only the most dramatic or convenient examples. Include apparently normal conditions and records that might challenge the remote interpretation. Where a measurement method has known limitations, preserve the information needed to assess whether those limitations affect the intended comparison.
Link field records to the corresponding remote observations without losing their original detail. Geographic matching, timing, and the scale represented by each record should remain visible. Review disagreements with the collecting team before changing a label or excluding an observation. A disagreement may reveal a timing mismatch, a mixed surface, or an incomplete interpretation rather than a simple error. The field programme should improve the understanding of the monitoring process as well as provide evidence for evaluating its outputs.
Bring the evidence back to the decision
A strong interpretation states what was observed, which explanations remain plausible, and what additional evidence would help distinguish them. Avoid presenting a convenient label as a confirmed cause when the measurements support only a broader pattern. Connect the proposed next step to the significance of the decision and the confidence available. This creates an interpretation that a field team, analyst, or project partner can examine, challenge, and improve as further observations become available.
Sources & further reading
Explore the bhumisat spacecraft concept and our vision towards 2030, or return to the journal.