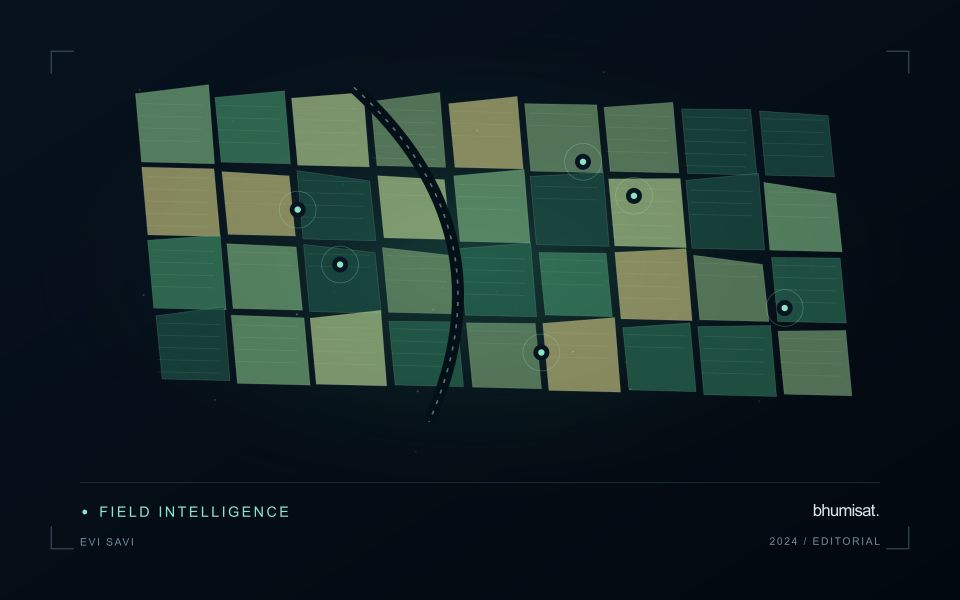
Comparisons through time are valuable only when the observations are sufficiently comparable for the question being asked. A difference between dates can reflect real change, a normal stage in a seasonal cycle, or a difference in how the surface was observed. This perspective examines the reference period, the timing of acquisitions, and the contextual records needed to interpret a sequence. It encourages the use of appropriate baselines rather than treating every previous observation as an equivalent benchmark. The objective is to identify changes that remain meaningful after normal variation and measurement conditions are considered.
This working guide considers choosing evi, savi and related indices in potato growing fields. The immediate decision is to focus scouting within potato fields. Useful reference evidence includes emergence records, canopy stage and representative plot observations. The case is an illustrative planning context, with assumptions to check against the actual sensor, landscape and project requirements.
The setting: Potato growing fields
Potato monitoring begins with the distinction between the canopy visible from above and the crop component ultimately harvested below ground. Establishment timing, variety, row structure and management can create different canopy patterns across fields. An image service should specify whether it is supporting crop-stage assessment, identifying areas for inspection or estimating a defined production variable. These objectives require different reference measurements and should not be combined into one unqualified vegetation score.
Maintain a field timeline that includes planting, emergence and the operations that can affect canopy appearance. Early observations may contain a large soil contribution, while later observations may show a more continuous canopy. Cloud and shadow contamination, field edges and neighbouring land cover can alter summaries at either stage. Compare observations using suitable quality rules and retain the acquisition dates so that a recent-looking map does not conceal an old measurement.
A field team should collect consistent crop-stage and canopy observations across both flagged and typical areas. Record management context and sampling support rather than relying on an isolated photograph. A vegetation change cannot establish the presence of a specific disease, and a canopy index is not a direct measurement of tuber yield. Evaluate any production model with appropriate harvest data and independent assessment, while keeping the simpler inspection-priority product transparent about what it actually observes.
Choose the index around the landscape
Vegetation indices emphasise selected relationships between spectral measurements. They are alternative views of the same observed surface, not independent diagnoses of a crop. EVI and SAVI were developed to address particular limitations encountered when interpreting vegetation signals, including background and canopy effects. Their usefulness depends on the data and landscape. A workflow should identify which limitation matters in its application before adding another index. Computing many indices without a clear comparison plan can increase complexity while leaving the original question unresolved.
SAVI introduces an adjustment intended to reduce sensitivity to soil brightness when vegetation cover is limited. The adjustment parameter should be chosen deliberately and retained in the processing record. EVI includes additional terms and commonly uses a blue band, making the quality of that measurement relevant to the result. Implementations must use the appropriate reflectance scaling and coefficient conventions. Applying a formula directly to stored integer values without considering offsets and scale factors can produce values that are mathematically calculable yet physically inconsistent.
Test whether the choice improves the decision
Compare candidate indices using the same quality-screened observations, field boundaries and independent evaluation sample. Otherwise a difference in performance might reflect a different set of pixels or dates rather than the index itself. Inspect sparse, intermediate and dense canopy conditions separately. Include soil exposure and recent management operations in the interpretation. A result that appears clearer on a colour map still needs to be tested against the variable of interest or the operational decision the service is expected to support.
The final choice should also account for maintenance and communication. An index that gives a modest improvement but depends on a less reliable band may require additional quality controls. Users should be told which observations were excluded and why a value is missing. Keep the selected method stable during an evaluation period, and version later changes so that historical comparisons remain interpretable. A concise set of well-understood indicators usually supports a stronger service than a long list of unexplained metrics that imply more certainty than the measurements justify.
Prioritise alerts using evidence and consequence
An alert is a request for attention, so its design should consider both the evidence available and the cost of responding. Begin by distinguishing a measured change, a proposed interpretation, and the action expected from the recipient. A large numerical difference is not automatically the most urgent case. The significance of the location, the age of the observation, the confidence in the interpretation, and the consequences of delay can all influence priority.
Create a review queue with enough context to support consistent decisions. Useful information can include the supporting dates, quality qualifications, previous observations, geographic unit, and the reason the case entered the queue. Define when an alert can be closed, escalated, or held for another observation. A documented rule is easier to improve than an informal practice that depends entirely on the memory of the operator reviewing the result.
Collect feedback from inspections and operational responses. Record alerts that led to a useful finding, alerts that required no action, and important conditions that the system failed to flag. Review these outcomes across different settings rather than relying only on a total count of alerts. The objective is a queue that directs limited attention towards meaningful decisions, while generating evidence for adjusting thresholds, improving context, and reducing repeated sources of unnecessary work.
Keep an auditable review record
A review record should explain how a result moved from an analytical output to an accepted interpretation or operational decision. Preserve the product identifier, the evidence considered, the reviewer role, and the outcome of the review. A short, consistent record is often more useful than an extensive free-text note that cannot be compared between cases. The objective is to make important decisions traceable without turning routine review into unnecessary administrative work.
Separate observations from conclusions within the record. Describe the evidence visible to the reviewer, the alternative explanations considered where relevant, and the reason for accepting, qualifying, or rejecting the result. If a correction is required, identify what should change and how the revised product relates to the earlier version. Keep unresolved questions visible so that they can be addressed by another observation or by the person responsible for the next action.
Use the accumulated record to improve the workflow. Recurring review reasons can reveal unclear requirements, missing contextual information, unstable processing steps, or an evaluation gap. Examine whether similar cases receive similar decisions across reviewers and over time. Preserve the relationship between feedback and subsequent revisions so that improvements can be assessed against the evidence that motivated them. An auditable record supports learning, accountability, and consistent delivery while allowing the technical process to evolve.
Bring the evidence back to the decision
A useful comparison preserves the dates, quality conditions, and contextual assumptions behind its baseline. Review unusual results against the actual observation sequence rather than relying entirely on a summary statistic. Where seasonal timing is important, describe how comparable stages were identified. The resulting analysis should help users distinguish an informative change from an expected cycle or an observation artefact, while making gaps and remaining uncertainty visible enough to guide further investigation.
Sources & further reading
Explore the bhumisat spacecraft concept and our vision towards 2030, or return to the journal.