Every observation and interpretation contains uncertainty, but the sources and consequences of that uncertainty differ between applications. Some arise from acquisition conditions, others from reference measurements, processing choices, or the transfer of a model to a new setting. This perspective examines how those sources affect the decision a user is considering. It encourages teams to describe uncertainty in a form that can influence action, rather than adding a generic qualification at the end of a report. The objective is to support proportionate decisions while keeping the limits of the available evidence understandable.
This working guide considers choosing evi, savi and related indices in onion production beds. The immediate decision is to review beds with uneven establishment. Useful reference evidence includes planting dates, bed cover and crop-stage observations. The case is an illustrative planning context, with assumptions to check against the actual sensor, landscape and project requirements.
The setting: Onion production beds
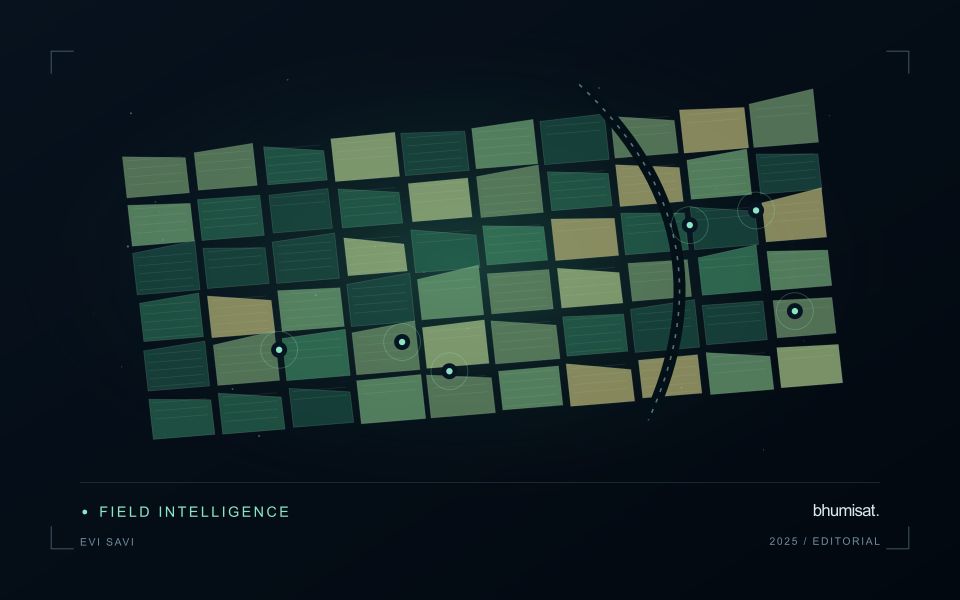
Onion fields can retain a strong soil contribution in optical imagery because of their canopy form and the arrangement of production beds. The proportion of exposed soil, the stage of the crop and the condition of neighbouring surfaces all matter to interpretation. A useful monitoring design begins by identifying whether it needs a field-level development indicator or more detailed bed-level information. The image data must genuinely support the scale at which conclusions are presented.
Maintain planting and management records alongside the image sequence, and distinguish normal stage differences from unusual spatial patterns. Small fields may contain only a limited number of observations that are not mixed with boundaries, tracks or other crops. Quality screening should account for this limitation rather than treating every nominal pixel as an independent view of onions. Comparable acquisition and processing conditions strengthen the interpretation of changes between reporting periods.
Field visits should record crop stage, stand continuity and the condition of the soil and bed surfaces contributing to the image. Sample across the mapped range, including areas that look typical, and preserve the location and date of each observation. A general reflectance pattern cannot directly establish bulb production or a named cause of stress. Those claims need appropriate measurements, while a transparent inspection-priority workflow can be evaluated through the outcomes of practical scouting visits.
Choose the index around the landscape
Vegetation indices emphasise selected relationships between spectral measurements. They are alternative views of the same observed surface, not independent diagnoses of a crop. EVI and SAVI were developed to address particular limitations encountered when interpreting vegetation signals, including background and canopy effects. Their usefulness depends on the data and landscape. A workflow should identify which limitation matters in its application before adding another index. Computing many indices without a clear comparison plan can increase complexity while leaving the original question unresolved.
SAVI introduces an adjustment intended to reduce sensitivity to soil brightness when vegetation cover is limited. The adjustment parameter should be chosen deliberately and retained in the processing record. EVI includes additional terms and commonly uses a blue band, making the quality of that measurement relevant to the result. Implementations must use the appropriate reflectance scaling and coefficient conventions. Applying a formula directly to stored integer values without considering offsets and scale factors can produce values that are mathematically calculable yet physically inconsistent.
Test whether the choice improves the decision
Compare candidate indices using the same quality-screened observations, field boundaries and independent evaluation sample. Otherwise a difference in performance might reflect a different set of pixels or dates rather than the index itself. Inspect sparse, intermediate and dense canopy conditions separately. Include soil exposure and recent management operations in the interpretation. A result that appears clearer on a colour map still needs to be tested against the variable of interest or the operational decision the service is expected to support.
The final choice should also account for maintenance and communication. An index that gives a modest improvement but depends on a less reliable band may require additional quality controls. Users should be told which observations were excluded and why a value is missing. Keep the selected method stable during an evaluation period, and version later changes so that historical comparisons remain interpretable. A concise set of well-understood indicators usually supports a stronger service than a long list of unexplained metrics that imply more certainty than the measurements justify.
Represent gaps without inventing observations
A monitoring sequence often contains periods without a usable observation. The reason may be cloud, shadow, missing coverage, a failed transfer, or a quality condition that excludes the data. Begin by representing these states explicitly. A missing observation is different from a low measurement, an unchanged surface, or a confirmed absence of the feature being studied. The distinction should survive both the analysis and the presentation of the result.
Define when a temporal gap is acceptable for the intended decision. A workflow may continue using the latest qualified observation, request another source, or suspend an alert until sufficient evidence is available. Whichever response is selected, show the age of the supporting observation. If interpolation is used for a suitable analytical purpose, preserve the distinction between an estimated value and a directly observed measurement, together with the assumptions needed to interpret it.
Review how gaps affect the coverage of the final evaluation. Locations with frequent missing data may differ systematically from those with regular observations. A performance estimate based only on clear, complete records can therefore describe a narrower population than the service is expected to support. Report usable coverage alongside analytical results and use recurring gaps to guide acquisition planning, reference collection, and the selection of complementary observation methods.
Use observation labels with consistent meanings
A reference label should describe an observation that another person could recognise or reproduce. Broad terms such as good, damaged, or unusual can conceal substantial differences between collection teams. Begin by defining the feature or condition being recorded, the observation unit, and the evidence needed to assign a label. Where possible, distinguish a direct measurement from an interpretation made by the observer.
Provide a short collection guide with examples, boundary cases, and a way to record uncertainty. Train observers using shared cases before relying on independently collected labels. If two observers disagree, preserve the disagreement long enough to understand its cause. It may reveal an unclear definition, a genuinely ambiguous condition, a difference in observation scale, or a problem in matching the reference record to the remote measurement.
Retain the context that makes the label interpretable. Location, time, collection method, observer role, and relevant surface conditions can be essential for later review. Changes to the label scheme should be documented and related to earlier versions where a defensible correspondence exists. Consistent labels do not eliminate uncertainty, but they make it possible to investigate disagreement, evaluate analytical methods, and identify where better definitions or additional measurements would improve the evidence.
Bring the evidence back to the decision
Useful uncertainty communication identifies the limitation, explains how it could affect the result, and connects it to a practical response. Some decisions can proceed with a qualified estimate; others require another observation or an independent check. Preserve uncertainty information through processing and delivery so that it is available at the point of use. This makes the analysis more accountable and gives the team a clearer basis for deciding which additional evidence would most improve the outcome.
Sources & further reading
Explore the bhumisat spacecraft concept and our vision towards 2030, or return to the journal.