An analytical result becomes operational information only when the receiving team can understand it and use it within existing responsibilities. Handoffs often fail because assumptions that were obvious to the analyst are absent from the delivered product. This perspective considers the information needed at that boundary: acquisition time, processing status, geographic scope, quality qualifications, and the action expected from the recipient. It also asks how corrections and feedback should return to the producing team. A dependable handoff creates a shared understanding of the result, rather than merely transferring a file.
This working guide considers connecting drone surveys with satellite observations across urban tree canopies. The immediate decision is to prioritise tree-canopy inventory updates. Useful reference evidence includes crown boundaries, tree records and dated site observations. The case is an illustrative planning context, with assumptions to check against the actual sensor, landscape and project requirements.
The setting: Urban tree canopies
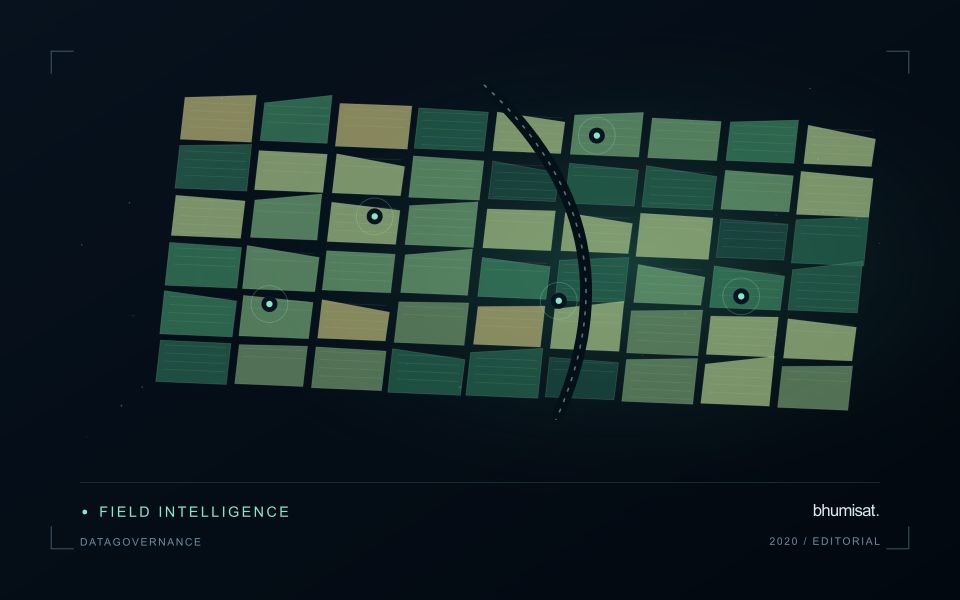
Urban trees occur among buildings, roads, gardens, utility corridors and other surfaces that complicate a remotely observed canopy pattern. A useful monitoring task might concern the extent of tree cover, a change in a park or an update to a municipal inventory. These tasks do not automatically provide a measurement of individual tree condition. Decide which spatial unit and management decision are relevant before presenting the imagery as a detailed tree assessment.
Building shadows, small crowns and mixed pixels deserve careful treatment. A street tree can be narrower than the observation footprint, while a large park canopy may support a more stable area-level summary. Compare acquisitions with suitable quality and geometry, and inspect whether seasonal foliage changes or recent maintenance explain the result. Existing inventory records can help interpret a pattern, but their dates and positional accuracy should also be reviewed.
Field validation should distinguish the presence and extent of a canopy from a diagnosis about the tree beneath it. Record tree or plot locations, crown context, recent management and the observations needed by the intended application. If the service supports maintenance planning, evaluate whether it improves the selection of useful inspection sites. Questions about structural safety, species identity or specific causes of decline require appropriate additional evidence rather than inference from a vegetation response alone.
Give each platform a clear role
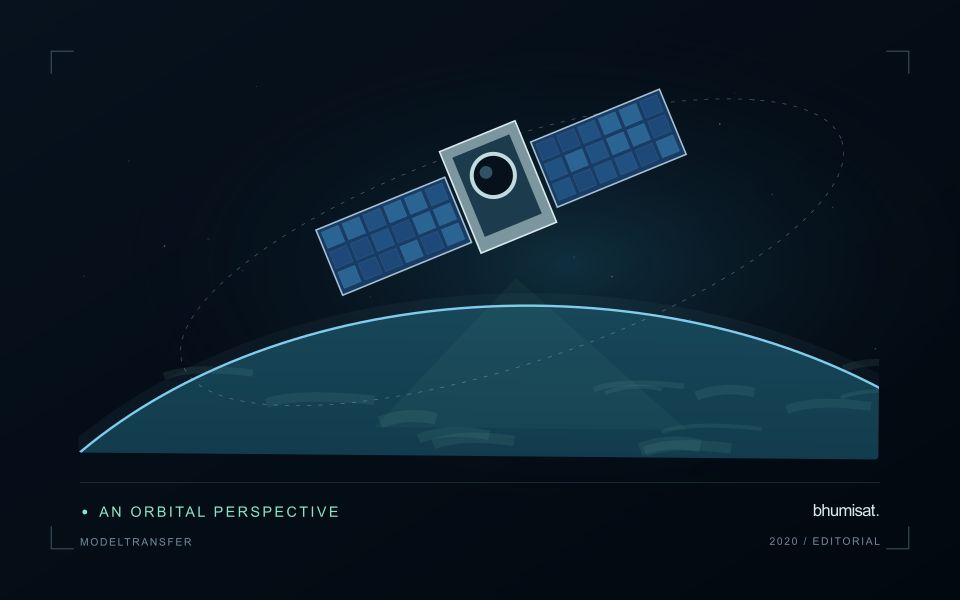
Drone surveys and satellites observe the same landscape at different scales and with different constraints. A drone can collect detailed local observations at a selected time, while satellites provide repeated coverage over larger regions. Combining them is useful when the local survey answers a specific question: checking crop rows, describing canopy gaps, measuring a surface, or supporting reference interpretation. Define that role before planning the flight. A detailed orthomosaic does not automatically become accurate reference data merely because its pixels are small.
Radiometric consistency requires attention to exposure settings, sensor response, illumination, and calibration targets where appropriate. Geometric quality depends on camera calibration, flight geometry, image overlap, tie points, and the accuracy of positioning and ground control. Surface reconstruction can struggle over water, moving vegetation, uniform textures, or repeated patterns. Keep independent checkpoints separate from control points used to fit the reconstruction, and evaluate horizontal and vertical accuracy against the requirements of the intended measurement.
Compare like with like
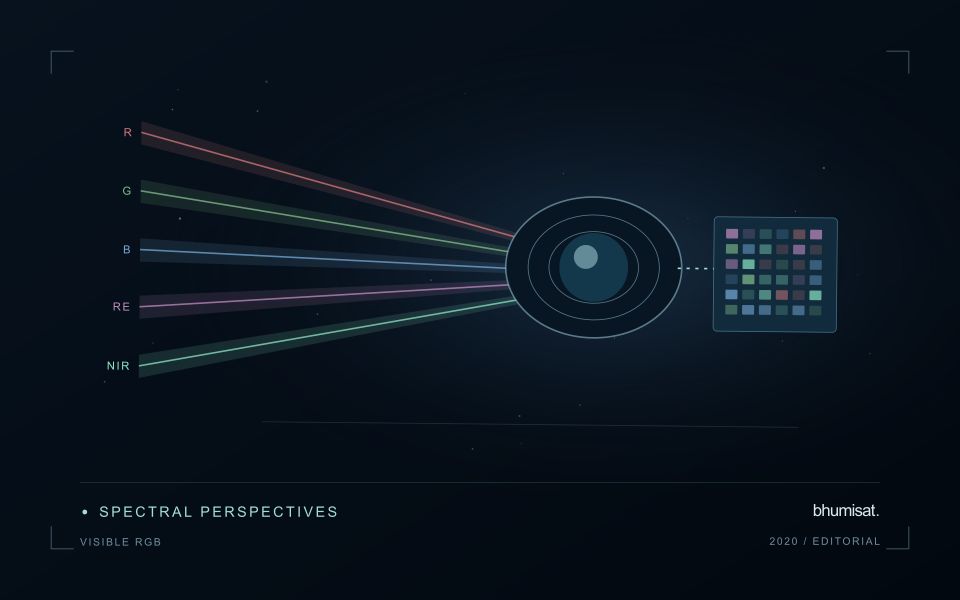
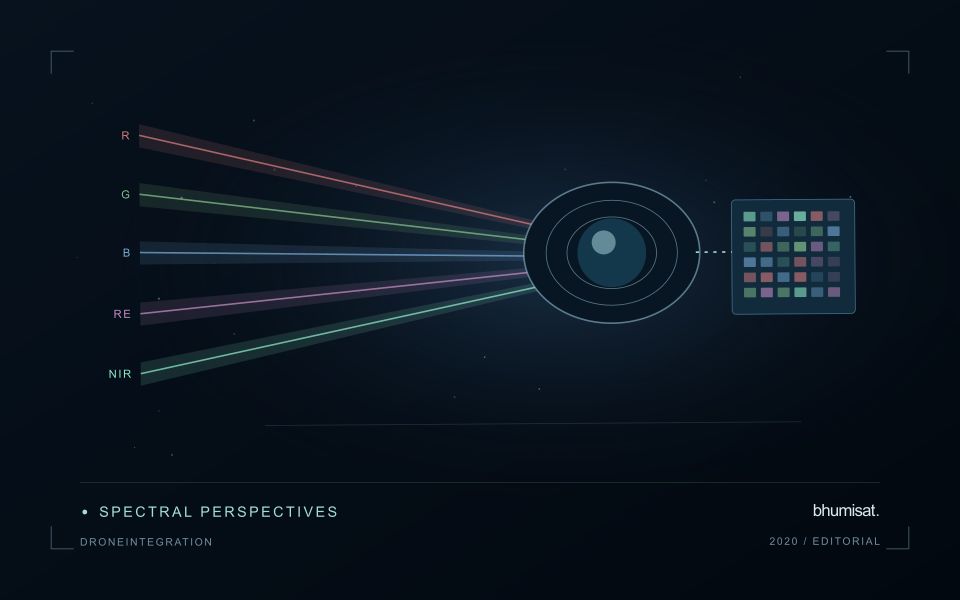
Align coordinate systems, vertical datums where relevant, and acquisition times before comparing products. A field can change after irrigation, rainfall, harvest, or a different sun angle, so a convenient date may not represent the satellite overpass. Satellite bands also have different spectral response functions from a drone camera. Matching band names does not guarantee that their reflectance values are equivalent. Describe these differences and select a comparison that the measurements can support.
Aggregate drone observations to the satellite pixel footprint or another justified analysis unit rather than simply sharpening the satellite grid. Include edge effects, positional uncertainty, and spatial heterogeneity in the comparison. A satellite pixel may mix trees, soil, shade, and roads that the drone resolves individually. Sample drone sites across the conditions present in the larger region; surveying only easy access sites can bias a calibration model. Keep training and evaluation locations independent when drone products support machine learning. Deliver the local survey with flight dates, processing settings, calibration records, accuracy checks, and known gaps. The combined workflow should make the relationship between local detail and regional inference explicit, including where the drone sample does not justify extrapolation.
Match the timing of reference observations
The value of a reference measurement depends partly on how well its timing matches the observation being evaluated. A surface, crop, water body, or instrument state may change between the two measurements. Start by documenting the acquisition time of every source and the period over which the reference observation applies. Avoid treating a date entered during data upload as though it were necessarily the time when the measurement was collected.
Define an acceptable timing relationship for the application. A slowly changing structural feature may tolerate a broader comparison window than a rapidly changing surface condition. The window should be justified by the process being studied and by any available contextual records. If conditions change within that period, consider separating the observations into suitable groups rather than combining them under a single assumption of comparability.
Preserve information about interventions and events between observations. A management operation, rainfall episode, disturbance, or change in sensor configuration can alter the interpretation of a comparison. Record the event and decide whether the pair remains suitable for evaluation. Where the timing mismatch cannot be resolved, describe the comparison as qualified evidence. This is more informative than allowing an uncertain match to influence a performance statistic without explanation.
Deliver quality flags that users can interpret
Quality information should describe the condition of an observation in terms that remain useful through the workflow. A single valid or invalid label may be sufficient for some calculations, but operational users often need to know why an observation was qualified. Distinguish acquisition limitations, processing failures, uncertain reference matches, and conditions that make interpretation ambiguous. These categories point towards different responses and should not be merged without a clear purpose.
Define a small, documented set of flags with stable meanings. Record whether a flag applies to a complete scene, a geographic unit, an individual measurement, or a derived result. A unit containing a mixture of qualified and unqualified observations may also require a coverage measure. Include the rule used to combine flags when summarising data so that a favourable average does not conceal a substantial fraction of unusable input.
Test the flags with the people receiving the product. Ask what they would do differently for each state and whether the terminology supports that choice. Keep the original flags available even if the interface presents a simpler summary. When flag definitions change, version the rules and review their effects on historical comparisons. Useful quality communication makes the condition of the evidence visible at the moment when a user decides how much confidence to place in the result.
Bring the evidence back to the decision
A successful handoff leaves the recipient with a clear result, sufficient context, and a practical route for raising questions. Test the delivery with the people who will use it, including how they respond when observations are missing or qualified. Capture their feedback as evidence for improving the product. The most useful delivery format is the one that preserves the relevant technical meaning while fitting the decisions, time constraints, and responsibilities of its intended audience.
Sources & further reading
Explore the bhumisat spacecraft concept and our vision towards 2030, or return to the journal.