Comparisons through time are valuable only when the observations are sufficiently comparable for the question being asked. A difference between dates can reflect real change, a normal stage in a seasonal cycle, or a difference in how the surface was observed. This perspective examines the reference period, the timing of acquisitions, and the contextual records needed to interpret a sequence. It encourages the use of appropriate baselines rather than treating every previous observation as an equivalent benchmark. The objective is to identify changes that remain meaningful after normal variation and measurement conditions are considered.
This working guide considers connecting drone surveys with satellite observations across sediment-runoff catchments. The immediate decision is to connect sampling priorities across land and water. Useful reference evidence includes timed water samples, runoff context and land-cover observations. The case is an illustrative planning context, with assumptions to check against the actual sensor, landscape and project requirements.
The setting: Sediment-runoff catchments
A catchment monitoring project connects land-cover patterns, drainage pathways and observations of receiving waters. These evidence streams operate at different spatial and temporal scales. A bare land patch or a bright water plume may be relevant to a sampling question, but an image alone does not establish that one caused the other. Define whether the task is mapping potential source areas, tracking a visible water pattern or evaluating a particular sediment-related variable.
Maintain suitable land and water masks and compare acquisitions with their rainfall and flow context where that information is available. Clouds can obscure the period of greatest interest, and conditions may change rapidly after runoff events. Land adjacency, shallow water and surface reflections can also affect optical interpretation. A useful monitoring record identifies the dates and valid areas supporting each observation instead of presenting a continuous causal story across missing measurements.
Field validation should collect water measurements with clear location, timing and sampling methods, alongside the evidence used to describe land conditions. Sampling only the most obvious plume may overlook other parts of the response or ordinary background variation. More specific source attribution needs an investigation designed for that claim. A practical first product can organise catchment observations and prioritise coordinated sampling, while keeping remotely observed associations distinct from explanations established through additional measurements.
Give each platform a clear role
Drone surveys and satellites observe the same landscape at different scales and with different constraints. A drone can collect detailed local observations at a selected time, while satellites provide repeated coverage over larger regions. Combining them is useful when the local survey answers a specific question: checking crop rows, describing canopy gaps, measuring a surface, or supporting reference interpretation. Define that role before planning the flight. A detailed orthomosaic does not automatically become accurate reference data merely because its pixels are small.
Radiometric consistency requires attention to exposure settings, sensor response, illumination, and calibration targets where appropriate. Geometric quality depends on camera calibration, flight geometry, image overlap, tie points, and the accuracy of positioning and ground control. Surface reconstruction can struggle over water, moving vegetation, uniform textures, or repeated patterns. Keep independent checkpoints separate from control points used to fit the reconstruction, and evaluate horizontal and vertical accuracy against the requirements of the intended measurement.
Compare like with like
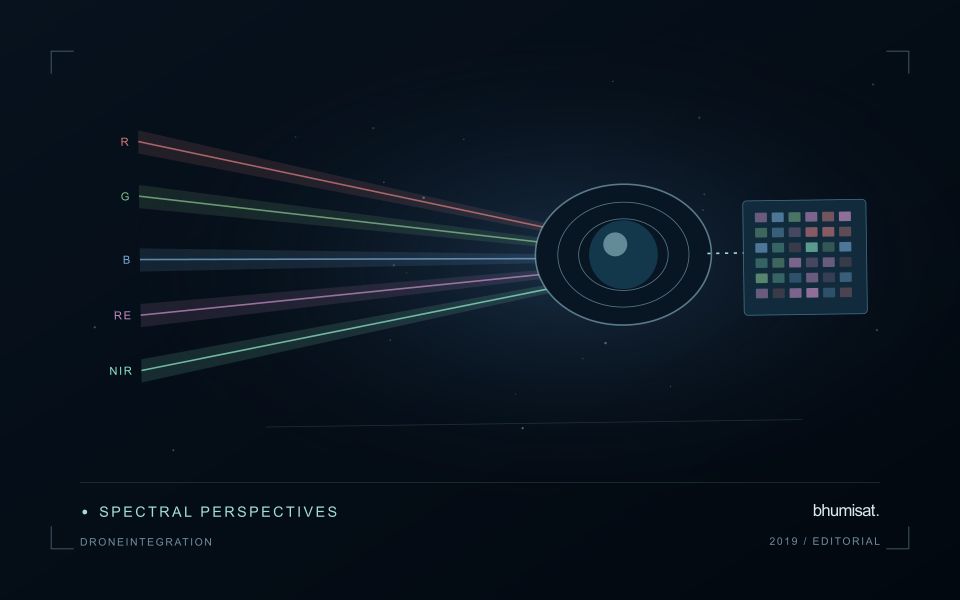
Align coordinate systems, vertical datums where relevant, and acquisition times before comparing products. A field can change after irrigation, rainfall, harvest, or a different sun angle, so a convenient date may not represent the satellite overpass. Satellite bands also have different spectral response functions from a drone camera. Matching band names does not guarantee that their reflectance values are equivalent. Describe these differences and select a comparison that the measurements can support.
Aggregate drone observations to the satellite pixel footprint or another justified analysis unit rather than simply sharpening the satellite grid. Include edge effects, positional uncertainty, and spatial heterogeneity in the comparison. A satellite pixel may mix trees, soil, shade, and roads that the drone resolves individually. Sample drone sites across the conditions present in the larger region; surveying only easy access sites can bias a calibration model. Keep training and evaluation locations independent when drone products support machine learning. Deliver the local survey with flight dates, processing settings, calibration records, accuracy checks, and known gaps. The combined workflow should make the relationship between local detail and regional inference explicit, including where the drone sample does not justify extrapolation.
Budget the complete processing workflow
A processing budget should cover the complete path from source observations to a maintained product. Data access and computing are only part of that path. Include preparation, geographic updates, reference collection, expert review, delivery, and support where those activities belong to the service. A calculation that runs cheaply on a small demonstration can still require substantial effort when the surrounding work is repeated across many locations.
Measure representative tasks rather than assuming that every observation costs the same amount to process. Record data volume, processing time, retry frequency, manual interventions, and the conditions that create unusually demanding cases. Separate fixed setup work from work that grows with the number of observations or users. These records support decisions about batching, caching, storage policy, and the point at which a different processing design becomes worthwhile.
Connect the budget to a defined level of service. Faster delivery, more frequent observation, broader coverage, or more detailed review can each change the resources required. Describe these trade-offs before promising a delivery pattern that the workflow has not demonstrated. Review the budget using operational evidence and preserve enough detail to understand changes between processing versions. The aim is a sustainable service whose resource choices remain aligned with the information that users value.
Match coastal observations with changing conditions
Coastal observations can be influenced by conditions that change within a day as well as across seasons. The meaning of an image or reference measurement may depend on water level, currents, recent weather, and the state of the surrounding land. Begin by documenting the exact acquisition time and the contextual records relevant to the question. A comparison based only on calendar dates can conceal differences that are important to interpretation.
Define which conditions need to be comparable across observations. A shoreline analysis, an intertidal habitat study, and an investigation of water appearance can require different timing assumptions. Select reference locations and measurement procedures that address the specific application. Preserve information about observation depth, sampling position, and the duration represented by a reference measurement where those details affect the comparison.
Review apparent differences against the physical and observational context before assigning a cause. A change in visible extent or spectral response may reflect the state of the water and atmosphere as well as a change in the feature being studied. Where suitable contextual information is unavailable, qualify the comparison or use additional observations to test competing explanations. A dependable coastal workflow makes its timing assumptions explicit and preserves the information needed to reconsider them when further evidence becomes available.
Bring the evidence back to the decision
A useful comparison preserves the dates, quality conditions, and contextual assumptions behind its baseline. Review unusual results against the actual observation sequence rather than relying entirely on a summary statistic. Where seasonal timing is important, describe how comparable stages were identified. The resulting analysis should help users distinguish an informative change from an expected cycle or an observation artefact, while making gaps and remaining uncertainty visible enough to guide further investigation.
Sources & further reading
Explore the bhumisat spacecraft concept and our vision towards 2030, or return to the journal.