Remote observations show patterns, while practical decisions depend on explaining what those patterns could mean. Interpretation therefore requires more than locating a high or low value on a map. A useful analysis considers the timing of the observation, the physical processes that influence the measurement, and the information available from complementary sources. This perspective separates an observed signal from a proposed explanation and from an action recommended to a user. Keeping those stages distinct makes it easier to investigate alternative causes, communicate ambiguity, and choose a proportionate next step.
This working guide considers connecting drone surveys with satellite observations along riparian woodland corridors. The immediate decision is to review changes in river-side vegetation. Useful reference evidence includes bank locations, water conditions and canopy boundary observations. The case is an illustrative planning context, with assumptions to check against the actual sensor, landscape and project requirements.
The setting: Riparian woodland corridors
Riparian woodland forms a narrow and often irregular corridor beside a river or drainage network. Its observed appearance can change with water level, exposed sediment, neighbouring agriculture and the canopy itself. The first task is to define the corridor consistently and decide what the analysis should establish. Mapping woody-cover continuity, locating a possible clearing and evaluating a particular habitat attribute are different objectives even when they use some of the same imagery.
Narrow corridors are sensitive to mixed pixels and spatial alignment. A small offset can move an observation from tree cover into water or a neighbouring field. Review the suitability of the image resolution and boundary information before interpreting small changes. Comparisons should account for water context and image quality as well as seasonal vegetation conditions. Retain the dates and valid areas supporting each corridor-level summary or mapped change.
Field observations should locate the bank and canopy boundaries and describe the neighbouring surfaces represented by a sample. Include different corridor widths and vegetation arrangements in evaluation rather than assuming that one accessible site represents the whole network. A remotely observed break in cover may help focus a visit, but its cause needs investigation. More specific ecological interpretations require reference measurements designed for those outcomes, alongside the spatial evidence used to describe the corridor.
Give each platform a clear role
Drone surveys and satellites observe the same landscape at different scales and with different constraints. A drone can collect detailed local observations at a selected time, while satellites provide repeated coverage over larger regions. Combining them is useful when the local survey answers a specific question: checking crop rows, describing canopy gaps, measuring a surface, or supporting reference interpretation. Define that role before planning the flight. A detailed orthomosaic does not automatically become accurate reference data merely because its pixels are small.
Radiometric consistency requires attention to exposure settings, sensor response, illumination, and calibration targets where appropriate. Geometric quality depends on camera calibration, flight geometry, image overlap, tie points, and the accuracy of positioning and ground control. Surface reconstruction can struggle over water, moving vegetation, uniform textures, or repeated patterns. Keep independent checkpoints separate from control points used to fit the reconstruction, and evaluate horizontal and vertical accuracy against the requirements of the intended measurement.
Compare like with like
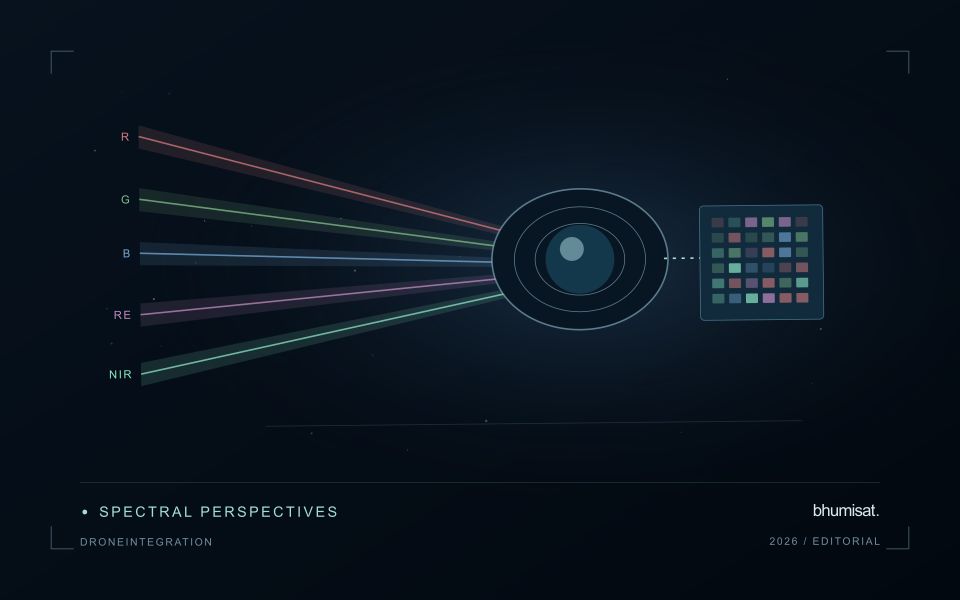
Align coordinate systems, vertical datums where relevant, and acquisition times before comparing products. A field can change after irrigation, rainfall, harvest, or a different sun angle, so a convenient date may not represent the satellite overpass. Satellite bands also have different spectral response functions from a drone camera. Matching band names does not guarantee that their reflectance values are equivalent. Describe these differences and select a comparison that the measurements can support.
Aggregate drone observations to the satellite pixel footprint or another justified analysis unit rather than simply sharpening the satellite grid. Include edge effects, positional uncertainty, and spatial heterogeneity in the comparison. A satellite pixel may mix trees, soil, shade, and roads that the drone resolves individually. Sample drone sites across the conditions present in the larger region; surveying only easy access sites can bias a calibration model. Keep training and evaluation locations independent when drone products support machine learning. Deliver the local survey with flight dates, processing settings, calibration records, accuracy checks, and known gaps. The combined workflow should make the relationship between local detail and regional inference explicit, including where the drone sample does not justify extrapolation.
Use observation labels with consistent meanings
A reference label should describe an observation that another person could recognise or reproduce. Broad terms such as good, damaged, or unusual can conceal substantial differences between collection teams. Begin by defining the feature or condition being recorded, the observation unit, and the evidence needed to assign a label. Where possible, distinguish a direct measurement from an interpretation made by the observer.
Provide a short collection guide with examples, boundary cases, and a way to record uncertainty. Train observers using shared cases before relying on independently collected labels. If two observers disagree, preserve the disagreement long enough to understand its cause. It may reveal an unclear definition, a genuinely ambiguous condition, a difference in observation scale, or a problem in matching the reference record to the remote measurement.
Retain the context that makes the label interpretable. Location, time, collection method, observer role, and relevant surface conditions can be essential for later review. Changes to the label scheme should be documented and related to earlier versions where a defensible correspondence exists. Consistent labels do not eliminate uncertainty, but they make it possible to investigate disagreement, evaluate analytical methods, and identify where better definitions or additional measurements would improve the evidence.
Maintain the geographic units of analysis
Many observation services summarise measurements within a field, management block, catchment, forest unit, or other mapped boundary. The meaning of that summary depends on whether the boundary accurately represents the unit being discussed. Start with a clear source for the geometry and record its date, coordinate reference, and intended use. A boundary drawn for visual orientation may require additional checking before it becomes a measurement unit.
Inspect overlaps, gaps, narrow fragments, and features that may have changed since mapping. A geometrically valid polygon can still describe an outdated operational unit. Ask the responsible team how divisions, mergers, new infrastructure, and management changes are recorded. Where pixels or reference measurements cross a boundary, define how they are assigned or excluded so that results remain comparable between analysts and processing runs.
Version the boundaries alongside the observations. If a unit changes, preserve a relationship between the previous and revised geometry rather than replacing the history without explanation. Comparisons through time should identify whether they use a constant spatial unit or the operational units valid at each date. This makes it easier to distinguish a change in the measured surface from a change introduced by the geography used to summarise it.
Bring the evidence back to the decision
A strong interpretation states what was observed, which explanations remain plausible, and what additional evidence would help distinguish them. Avoid presenting a convenient label as a confirmed cause when the measurements support only a broader pattern. Connect the proposed next step to the significance of the decision and the confidence available. This creates an interpretation that a field team, analyst, or project partner can examine, challenge, and improve as further observations become available.
Sources & further reading
Explore the bhumisat spacecraft concept and our vision towards 2030, or return to the journal.