Comparisons through time are valuable only when the observations are sufficiently comparable for the question being asked. A difference between dates can reflect real change, a normal stage in a seasonal cycle, or a difference in how the surface was observed. This perspective examines the reference period, the timing of acquisitions, and the contextual records needed to interpret a sequence. It encourages the use of appropriate baselines rather than treating every previous observation as an equivalent benchmark. The objective is to identify changes that remain meaningful after normal variation and measurement conditions are considered.
This working guide considers connecting drone surveys with satellite observations in cotton production fields. The immediate decision is to prioritise cotton field scouting. Useful reference evidence includes planting dates, growth stage and canopy observations. The case is an illustrative planning context, with assumptions to check against the actual sensor, landscape and project requirements.
Give each platform a clear role
Drone surveys and satellites observe the same landscape at different scales and with different constraints. A drone can collect detailed local observations at a selected time, while satellites provide repeated coverage over larger regions. Combining them is useful when the local survey answers a specific question: checking crop rows, describing canopy gaps, measuring a surface, or supporting reference interpretation. Define that role before planning the flight. A detailed orthomosaic does not automatically become accurate reference data merely because its pixels are small.
Radiometric consistency requires attention to exposure settings, sensor response, illumination, and calibration targets where appropriate. Geometric quality depends on camera calibration, flight geometry, image overlap, tie points, and the accuracy of positioning and ground control. Surface reconstruction can struggle over water, moving vegetation, uniform textures, or repeated patterns. Keep independent checkpoints separate from control points used to fit the reconstruction, and evaluate horizontal and vertical accuracy against the requirements of the intended measurement.
Compare like with like
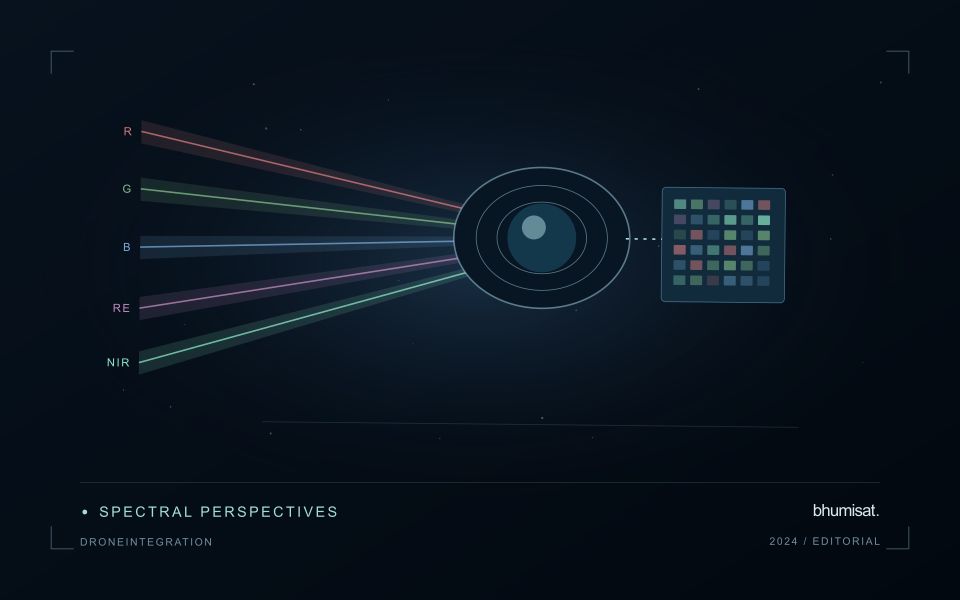
Align coordinate systems, vertical datums where relevant, and acquisition times before comparing products. A field can change after irrigation, rainfall, harvest, or a different sun angle, so a convenient date may not represent the satellite overpass. Satellite bands also have different spectral response functions from a drone camera. Matching band names does not guarantee that their reflectance values are equivalent. Describe these differences and select a comparison that the measurements can support.
Aggregate drone observations to the satellite pixel footprint or another justified analysis unit rather than simply sharpening the satellite grid. Include edge effects, positional uncertainty, and spatial heterogeneity in the comparison. A satellite pixel may mix trees, soil, shade, and roads that the drone resolves individually. Sample drone sites across the conditions present in the larger region; surveying only easy access sites can bias a calibration model. Keep training and evaluation locations independent when drone products support machine learning. Deliver the local survey with flight dates, processing settings, calibration records, accuracy checks, and known gaps. The combined workflow should make the relationship between local detail and regional inference explicit, including where the drone sample does not justify extrapolation.
The setting: Cotton production fields
Cotton fields can differ in planting time, variety, stand density and management, producing different image trajectories through the season. A monitoring programme should organise those differences before deciding which fields are unusual. Early observations often combine crop and soil, while later management and crop-stage changes can alter the canopy in ways that require contextual interpretation. A reliable field calendar is therefore as important as the choice of a vegetation measure.
Compare observations that meet consistent quality requirements and inspect whether a mapped pattern persists across suitable dates. Field boundaries, tracks, wet areas and neighbouring crops can affect irregular management units. Record the valid area contributing to a summary, especially when clouds or shadows leave only part of a field visible. If several image products are combined, evaluate their alignment and measurement consistency before treating a difference as evidence of crop change.
A scouting visit should collect observations that address the intended decision, such as uneven development or a need for agronomic review. Record crop stage, recent operations and the sampling area consistently. An optical anomaly is not a direct measurement of fibre characteristics or a confirmed diagnosis of a particular problem. Models for commercial outcomes require corresponding reference data and independent evaluation, while inspection products can be assessed through their usefulness in directing representative and timely field visits.
Prioritise alerts using evidence and consequence
An alert is a request for attention, so its design should consider both the evidence available and the cost of responding. Begin by distinguishing a measured change, a proposed interpretation, and the action expected from the recipient. A large numerical difference is not automatically the most urgent case. The significance of the location, the age of the observation, the confidence in the interpretation, and the consequences of delay can all influence priority.
Create a review queue with enough context to support consistent decisions. Useful information can include the supporting dates, quality qualifications, previous observations, geographic unit, and the reason the case entered the queue. Define when an alert can be closed, escalated, or held for another observation. A documented rule is easier to improve than an informal practice that depends entirely on the memory of the operator reviewing the result.
Collect feedback from inspections and operational responses. Record alerts that led to a useful finding, alerts that required no action, and important conditions that the system failed to flag. Review these outcomes across different settings rather than relying only on a total count of alerts. The objective is a queue that directs limited attention towards meaningful decisions, while generating evidence for adjusting thresholds, improving context, and reducing repeated sources of unnecessary work.
Deliver quality flags that users can interpret
Quality information should describe the condition of an observation in terms that remain useful through the workflow. A single valid or invalid label may be sufficient for some calculations, but operational users often need to know why an observation was qualified. Distinguish acquisition limitations, processing failures, uncertain reference matches, and conditions that make interpretation ambiguous. These categories point towards different responses and should not be merged without a clear purpose.
Define a small, documented set of flags with stable meanings. Record whether a flag applies to a complete scene, a geographic unit, an individual measurement, or a derived result. A unit containing a mixture of qualified and unqualified observations may also require a coverage measure. Include the rule used to combine flags when summarising data so that a favourable average does not conceal a substantial fraction of unusable input.
Test the flags with the people receiving the product. Ask what they would do differently for each state and whether the terminology supports that choice. Keep the original flags available even if the interface presents a simpler summary. When flag definitions change, version the rules and review their effects on historical comparisons. Useful quality communication makes the condition of the evidence visible at the moment when a user decides how much confidence to place in the result.
Bring the evidence back to the decision
A useful comparison preserves the dates, quality conditions, and contextual assumptions behind its baseline. Review unusual results against the actual observation sequence rather than relying entirely on a summary statistic. Where seasonal timing is important, describe how comparable stages were identified. The resulting analysis should help users distinguish an informative change from an expected cycle or an observation artefact, while making gaps and remaining uncertainty visible enough to guide further investigation.
Sources & further reading
Explore the bhumisat spacecraft concept and our vision towards 2030, or return to the journal.