Remote observations show patterns, while practical decisions depend on explaining what those patterns could mean. Interpretation therefore requires more than locating a high or low value on a map. A useful analysis considers the timing of the observation, the physical processes that influence the measurement, and the information available from complementary sources. This perspective separates an observed signal from a proposed explanation and from an action recommended to a user. Keeping those stages distinct makes it easier to investigate alternative causes, communicate ambiguity, and choose a proportionate next step.
This working guide considers turning collected imagery into delivered data in cassava production plots. The immediate decision is to select plots for crop-stage assessment. Useful reference evidence includes planting records, canopy cover and dated plot visits. The case is an illustrative planning context, with assumptions to check against the actual sensor, landscape and project requirements.
Start with the data that must reach users
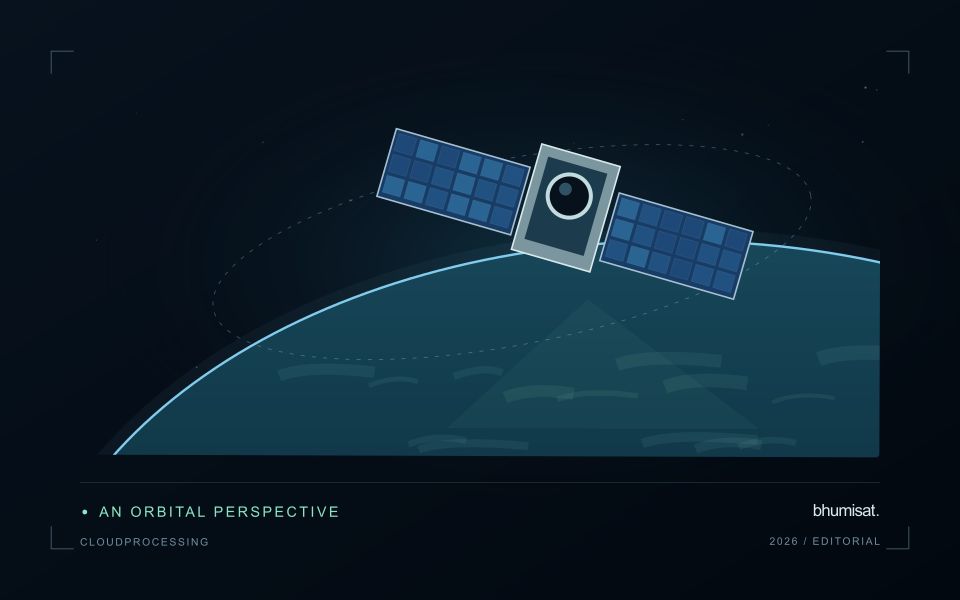
A satellite camera's collection rate and a radio's advertised bit rate do not determine how much useful imagery reaches the ground. The complete data path includes detector output, onboard processing, storage, contact scheduling, transmission and ground processing. Each stage can constrain delivery. Begin with an observation plan and estimate the data it generates, including spectral bands, sampling, encoding, metadata and housekeeping information.
Distinguish raw payload rate from the net rate available for science files. Framing, error control, protocol overhead and operational interruptions reduce effective throughput. Compression can lower volume, but its value depends on scene content and acceptable information loss. Test a representative range of imagery and assess whether any lossy approach alters the measurements needed by the application. A visually pleasing result is not sufficient evidence for quantitative analysis.
Model contacts, storage and recovery together
Ground contacts depend on orbit geometry, station location, visibility constraints and access to the station schedule. The highest rate may be available only during part of a pass. A link budget combines transmitter power, antenna gains, propagation loss, receiver performance and other losses to assess whether the required performance is feasible. Antenna orientation and spacecraft pointing must be consistent with imaging, power generation and other operating demands.
Use a time ordered simulation to track the stored data backlog. Add each planned acquisition and subtract the amount that can actually be delivered during usable contacts. Include missed passes, reduced rates and retransmission policy where relevant. Storage must accommodate plausible disruptions as well as nominal operation. Define priorities and deletion rules before the buffer fills, preserving the metadata needed to identify what was collected and what was lost.
The ground segment needs more than an antenna. It must authenticate commands where applicable, receive and verify files, detect gaps, maintain acquisition records and feed the processing pipeline. Measure latency from observation to the user's usable product, since a successfully received file may still wait for calibration or quality checks. End to end tests should exercise realistic file sizes and interrupted transfers. A sound delivery plan balances collection ambition with energy, contact time and processing capacity, so that an observation schedule produces a dependable flow of usable information.
The setting: Cassava production plots
Cassava plots may have different planting dates, harvest strategies and mixtures of neighbouring vegetation. The commercial product develops below ground, while an optical satellite primarily observes the surface and canopy. This distinction is fundamental to the monitoring objective. A visible vegetation pattern can support investigation of plot development or cover, but a claim about root production needs a demonstrated relationship with representative harvest measurements for the relevant production setting.
Start with boundaries that describe the area actually planted and a calendar that captures establishment and any partial harvesting. Small plots can contain substantial mixed pixels along their margins, particularly where paths, trees or other crops surround them. Track the proportion of valid observations and the spatial support used for each summary. Repeated measurements should be compared in a way that accounts for plot age rather than assuming all cassava fields share a single seasonal cycle.
Field visits should record crop stage, canopy continuity, intercropping and management events that might explain the image pattern. Sampling locations need enough context to identify whether they represent the plot interior or an edge mixture. If an analytical model is developed, reserve independent plots or periods for evaluation and communicate its limits. A dependable first service may be a plot inventory and inspection workflow, with more specific production claims added only when the evidence supports them.
Maintain the geographic units of analysis
Many observation services summarise measurements within a field, management block, catchment, forest unit, or other mapped boundary. The meaning of that summary depends on whether the boundary accurately represents the unit being discussed. Start with a clear source for the geometry and record its date, coordinate reference, and intended use. A boundary drawn for visual orientation may require additional checking before it becomes a measurement unit.
Inspect overlaps, gaps, narrow fragments, and features that may have changed since mapping. A geometrically valid polygon can still describe an outdated operational unit. Ask the responsible team how divisions, mergers, new infrastructure, and management changes are recorded. Where pixels or reference measurements cross a boundary, define how they are assigned or excluded so that results remain comparable between analysts and processing runs.
Version the boundaries alongside the observations. If a unit changes, preserve a relationship between the previous and revised geometry rather than replacing the history without explanation. Comparisons through time should identify whether they use a constant spatial unit or the operational units valid at each date. This makes it easier to distinguish a change in the measured surface from a change introduced by the geography used to summarise it.
Define a representative reference sample
A reference sample should represent the situations in which a method will be used. Begin by defining the target population: locations, time periods, management conditions, surface types, or instrument states that belong within the intended application. A collection of convenient observations may be valuable for exploration, but it does not automatically support conclusions about that wider population. Make the scope of the sample visible before calculating a summary of performance.
Consider a stratified design when important conditions are unevenly represented. Relevant strata might include different landscape types, developmental stages, observation quality levels, or ranges of the variable being estimated. Choose sample locations within those groups using a documented rule, and retain the information needed to understand their selection. Where access restrictions affect the sample, record the excluded conditions so that the limits of the resulting evaluation remain clear.
Keep development and evaluation evidence separate where the purpose of the study requires an independent test. Nearby observations or repeated measurements can share information, so a random split of individual records may overstate independence. A split organised by location, period, or operational unit can provide a more demanding comparison. The appropriate design follows the intended deployment, the structure of the observations, and the errors that matter to the user.
Bring the evidence back to the decision
A strong interpretation states what was observed, which explanations remain plausible, and what additional evidence would help distinguish them. Avoid presenting a convenient label as a confirmed cause when the measurements support only a broader pattern. Connect the proposed next step to the significance of the decision and the confidence available. This creates an interpretation that a field team, analyst, or project partner can examine, challenge, and improve as further observations become available.
Sources & further reading
Explore the bhumisat spacecraft concept and our vision towards 2030, or return to the journal.